

68 Circular Road, #02-01 049422, Singapore
Revenue Tower, Scbd, Jakarta 12190, Indonesia
4th Floor, Pinnacle Business Park, Andheri East, Mumbai, 400093
Cinnabar Hills, Embassy Golf Links Business Park, Bengaluru, Karnataka 560071


Connect With Us


68 Circular Road, #02-01 049422, Singapore
Revenue Tower, Scbd, Jakarta 12190, Indonesia
4th Floor, Pinnacle Business Park, Andheri East, Mumbai, 400093
Cinnabar Hills, Embassy Golf Links Business Park, Bengaluru, Karnataka 560071
Connect With Us
68 Circular Road, #02-01 049422, Singapore
Revenue Tower, Scbd, Jakarta 12190, Indonesia
4th Floor, Pinnacle Business Park, Andheri East, Mumbai, 400093
Cinnabar Hills, Embassy Golf Links Business Park, Bengaluru, Karnataka 560071
Request Custom Transcript
AR/VR Training Simulators: Cloud Rendering Demands & ROI in Enterprise Upskilling
Enterprises in Egypt are shifting from classroom and 2D e-learning to immersive AR/VR training powered by cloud rendering and edge streaming. AR/VR training spend is projected to grow from ~$0.35B in 2025 to ~$1.36B by 2030, driven by safety, maintenance, and clinical use cases. Time-to-competency drops from 38 to 18 hours, pass rates rise from 72% to 88%, and error rates fall from 9.8% to 4.1%. Session latency improves from 85ms to 45ms, while training cost per employee declines from ~$420 to ~$310. With cloud GPU orchestration, edge streaming, and LMS integration, AR/VR enables faster, safer, and cost-efficient workforce training across Egypt.
What's Covered?
Report Summary
Key Takeaways
1. Cloud‑rendered VR with edge streaming reduces latency to ~45ms by 2030.
2. Adaptive scenarios and automated coaching lift pass rates and retention.
3. Competency‑based evaluation links training to on‑the‑job performance.
4. GPU scheduling and spot usage lower render cost per hour ~40%+.
5. Arabic localization and safety validation accelerate broader adoption.
6. Device fleet ops (updates/sanitation) sustain scale in field locations.
7. Incident reduction and faster ramp drive IRR to ~20% by 2030.
8. C‑suite dashboard: time‑to‑competency, pass %, error %, incidents/100 FTE, ms latency, $/hr, $/employee, IRR.

a) Market Size & Share
Egypt/MENA AR/VR training spend is modeled to grow from ~US$0.35B in 2025 to ~US$1.36B by 2030. The dual‑axis figure shows spend growth alongside a drop in average time‑to‑competency from ~38 to ~18 hours as programs scale and content libraries mature. Share concentrates with providers offering cloud GPU orchestration, edge streaming, and competency analytics integrated into LMS/LXP. Execution risks: device reliability, content refresh cycles, and network variability; mitigations: fleet ops, modular content, and metro edge deployments. Share tracking should weight time‑to‑competency, pass %, error %, incidents/100 FTE, latency ms, $/hr render, and $/employee trained.

b) Market Analysis
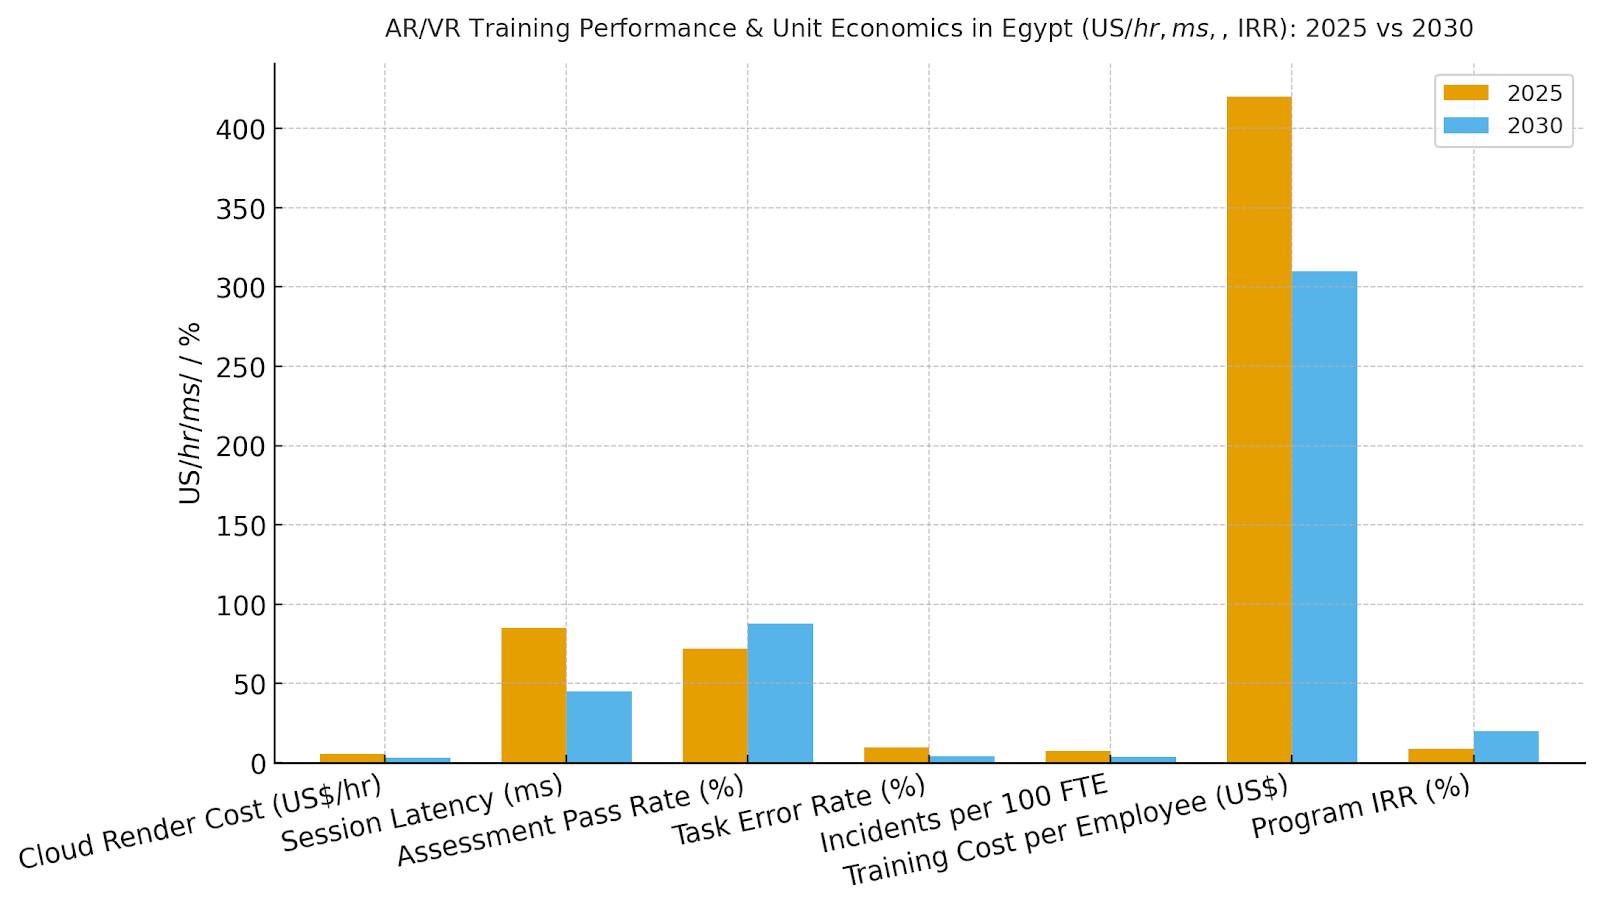
Our model shows render cost per hour falling from ~US$5.6 to ~US$3.2 via GPU pooling and scheduling; latency improving from ~85ms to ~45ms with edge streaming; pass rates rising from ~72% to ~88% as adaptive feedback and analytics drive mastery; task error rate halves to ~4.1%; incidents per 100 FTE drop ~50%; and cost per employee trained declines from ~US$420 to ~US$310 as travel and downtime fall. IRR increases ~9→~20% by 2030. Enablers: foveated rendering, codec optimization, and competency‑based design. Barriers: comfort issues, legacy LMS integrations, and device wear/tear. Financial lens: fewer incidents, faster productivity ramp, and lower travel/lab time. The bar figure summarizes KPI movement under disciplined programs.
c) Trends & Insights
1) Cloud‑rendered VR with edge streaming makes thin devices viable at sites. 2) Skills graphs map tasks to competencies and certification. 3) AI coaching agents provide real‑time feedback and confidence scoring. 4) Digital twins of plants/facilities support realistic maintenance scenarios. 5) Accessibility and comfort presets reduce motion sickness. 6) Arabic localization, voice, and signage accelerate adoption. 7) Safety validation frameworks emerge for high‑risk scenarios. 8) ESG reporting includes training‑time saved and incident reduction. 9) Device fleet telemetry informs repairs and refresh cycles. 10) Pricing shifts to outcome‑based models tied to proficiency.
d) Segment Analysis
Energy/Oil & Gas: safety and maintenance with hazardous scenario rehearsal. Manufacturing: complex assembly, quality control, and changeovers. Healthcare: clinical procedures and emergency response; sterility and comfort constraints matter. Logistics: picking, packing, forklift safety; KPI focus on throughput and incidents. Public Services: emergency services and urban planning scenarios. Retail: customer service, planogram execution, and loss prevention. Across segments, track time‑to‑competency, pass %, error %, incidents/100 FTE, latency ms, $/hr render, $/employee trained, and IRR.
e) Geography Analysis
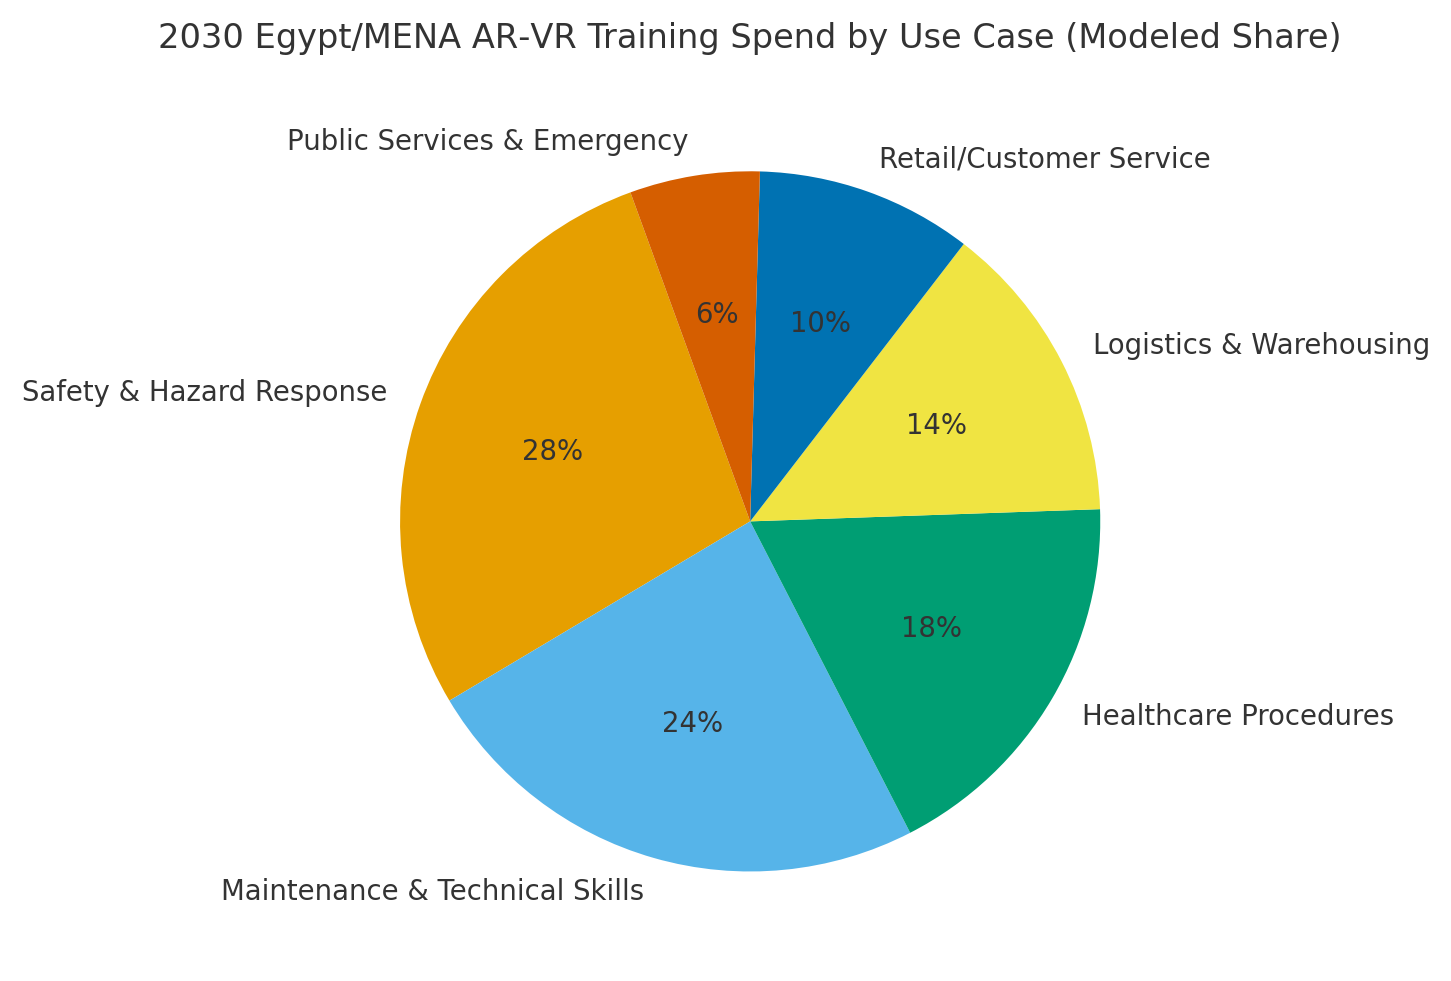
By 2030, we model Egypt/MENA use‑case mix as Safety & Hazard Response (~28%), Maintenance & Technical (~24%), Healthcare Procedures (~18%), Logistics & Warehousing (~14%), Retail/Customer Service (~10%), and Public Services & Emergency (~6%). The pie figure reflects the mix. Cairo and industrial zones adopt first due to cluster economics; tourism/retail follow with customer‑facing training. Execution: deploy metro edge PoPs, manage device fleets, localize content, and publish quarterly ROI dashboards.
f) Competitive Landscape
Competition spans global VR platforms, cloud GPU providers, regional integrators, and content studios. Differentiation vectors: (1) latency and comfort at scale, (2) GPU orchestration and cost per session, (3) competency analytics and LMS/LXP integrations, (4) Arabic localization and safety validation, and (5) device fleet ops. Procurement guidance: require open APIs, exportable competency data, edge PoP coverage maps, and SLA credits tied to latency/uptime and training outcomes. Competitive KPIs: time‑to‑competency, pass %, error %, incidents/100 FTE, ms latency, $/hr render, $/employee, and IRR uplift.
Report Details
Proceed To Buy
Want a More Customized Experience?
- Request a Customized Transcript: Submit your own questions or specify changes. We’ll conduct a new call with the industry expert, covering both the original and your additional questions. You’ll receive an updated report for a small fee over the standard price.
- Request a Direct Call with the Expert: If you prefer a live conversation, we can facilitate a call between you and the expert. After the call, you’ll get the full recording, a verbatim transcript, and continued platform access to query the content and more.
68 Circular Road, #02-01 049422, Singapore
Revenue Tower, Scbd, Jakarta 12190, Indonesia
4th Floor, Pinnacle Business Park, Andheri East, Mumbai, 400093
Cinnabar Hills, Embassy Golf Links Business Park, Bengaluru, Karnataka 560071
Request Custom Transcript
Related Transcripts
$ 1350

68 Circular Road, #02-01 049422, Singapore
Revenue Tower, Scbd, No.52-53, Jakarta 12190, Indonesia
Cinnabar Hills, Embassy Golf Links Business Park, Bengaluru, Karnataka 560071
4th Floor, Pinnacle Business Park, Andheri East, Mumbai, 400093


68 Circular Road, #02-01 049422, Singapore
Revenue Tower, Scbd, Jakarta 12190, Indonesia
4th Floor, Pinnacle Business Park, Andheri East, Mumbai, 400093
Cinnabar Hills, Embassy Golf Links Business Park, Bengaluru, Karnataka 560071