

68 Circular Road, #02-01 049422, Singapore
Revenue Tower, Scbd, Jakarta 12190, Indonesia
4th Floor, Pinnacle Business Park, Andheri East, Mumbai, 400093
Cinnabar Hills, Embassy Golf Links Business Park, Bengaluru, Karnataka 560071


Connect With Us


68 Circular Road, #02-01 049422, Singapore
Revenue Tower, Scbd, Jakarta 12190, Indonesia
4th Floor, Pinnacle Business Park, Andheri East, Mumbai, 400093
Cinnabar Hills, Embassy Golf Links Business Park, Bengaluru, Karnataka 560071
Connect With Us
68 Circular Road, #02-01 049422, Singapore
Revenue Tower, Scbd, Jakarta 12190, Indonesia
4th Floor, Pinnacle Business Park, Andheri East, Mumbai, 400093
Cinnabar Hills, Embassy Golf Links Business Park, Bengaluru, Karnataka 560071
Request Custom Transcript
AR-Enabled Virtual Try-Ons: Technical Implementation & Conversion Rate Optimization in Fashion E-Commerce
From 2025 to 2030, AR virtual try‑on (VTO) evolves from marketing novelty to a performance channel that measurably drives conversion, reduces returns, and lifts AOV across European fashion—with France as an early leader in premium/luxury adoption. The technical stack matures along three axes: (1) 3D asset pipelines that convert 2D catalog shots into physically plausible garments, supported by cloth simulation and body‑mesh estimation; (2) on‑device inference and WebAR runtimes that cut latency and broaden reach beyond apps; and (3) closed‑loop analytics that link VTO usage to PDP conversion, size accuracy, and post‑purchase outcomes. Fast fashion prioritizes scale (SKU coverage, quick asset generation), while luxury emphasizes fidelity (material rendering, drape, lighting) and premium brand control.
What's Covered?
Report Summary
Key Takeaways
1. VTO drives measurable CR and AOV when paired with size guidance and styled bundles, not as a standalone widget.
2. Latency and device compatibility decide adoption—WebAR reach plus app fidelity is a winning combo.
3. Neural asset pipelines cut cost/time, but quality gates (material, drape) are non‑negotiable for luxury.
4. Attribution requires geo/A‑B or holdouts; mere correlation won’t unlock budget.
5. GDPR and ePrivacy mandate explicit consent, data minimization, and transparent model usage.
6. Store‑connected use cases (kiosk, clienteling) extend impact to omnichannel and reduce returns.
7. 3D asset reuse (ads, PDP spins, social) amplifies ROI beyond try‑on alone.
8. Outcome‑based contracts tied to CR/returns/AOV lift will shape vendor selection.
Key Metrics

Market Size & Adoption
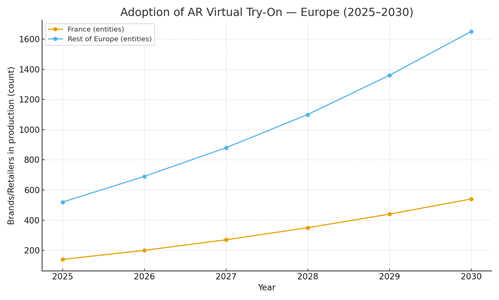
Adoption tracks two forces: (i) falling cost of high‑quality 3D assets via neural pipelines and (ii) browser‑level AR runtimes that remove app friction. In this illustrative outlook, France grows from ~140 production deployments in 2025 to ~540 by 2030, while the rest of Europe scales from ~520 to ~1,650. Fast fashion prioritizes breadth automating asset creation for top SKUs—whereas luxury emphasizes fidelity and storytelling. By 2030, AR try‑on is standard for footwear, eyewear, and accessories, with accelerating penetration in apparel categories that benefit from drape and fit cues.
Share consolidates around platforms that integrate 3D asset management, WebAR/app SDKs, and analytics linking VTO sessions to CR and returns. Vendors with direct PDP publish, variant mapping, and privacy‑ready telemetry win enterprise deals in France, where brand control, localization, and compliance are decisive.
Market Analysis
Performance lift depends on wiring VTO into the purchase journey. In this outlook, PDP conversion rates rise from ~2.1–2.5% to ~3.6–4.4% as try‑on appears above the fold, pre‑populates size guidance, and coordinates with styled bundles. Return rates fall ~6–7 pp when fit and material cues are reliable; AOV increases as accessories and warranties surface contextually during try‑on. Cost drivers include 3D asset creation, SDK licensing, and engineering to connect catalog, inventory, and analytics. Benefits include higher CR, reduced returns, and richer creative for ads and social without additional shoots.
Risks: slow time‑to‑first‑render, device fragmentation, inaccurate assets, and compliance missteps. Mitigations: device fallbacks and progressive rendering; strict QA gates for materials and drape; accessibility checks; and GDPR‑compliant consent and data minimization. ROI credibility hinges on rigorous causal testing (geo/A‑B, holdouts) and finance‑grade dashboards that tie VTO usage to deltas in CR, AOV, and return rates.

Trends & Insights (2025–2030)
• Neural asset generation accelerates 3D coverage from weeks to days with acceptable fidelity for fast fashion.
• On‑device inference and WebAR reduce latency and expand reach to mid‑tier devices; apps retain premium fidelity.
• Size/fit engines merge body‑mesh estimation with brand size charts to cut exchanges and returns.
• Clienteling and store mirrors bring VTO into omnichannel, aligning online inspiration with in‑store purchase.
• Asset reuse across retail media and social multiplies ROI; dynamic ads render try‑on variants.
• Privacy and accessibility become procurement must‑haves; audit trails document model use and user consent.
• Vendor consolidation: suites combine asset management, rendering SDKs, analytics, and governance.
• Outcome‑based pricing indexed to CR lift and return‑rate reduction gains traction with finance teams.
Segment Analysis (Fast Fashion vs Luxury)
• Fast Fashion: prioritize SKU coverage and speed; neural pipelines with QA can hit 70–85% of top‑seller coverage by 2030. WebAR ensures reach; returns improvement hinges on accurate size guidance and clear material cues. Use try‑on events to seed styled bundles and upsells.
• Luxury: fidelity and brand control matter most; invest in photogrammetry/CAD‑derived assets, high‑quality materials/shaders, and calibrated lighting. App‑based rendering delivers premium experience; clienteling tools extend try‑on to boutiques. Returns reduction is meaningful where fit accuracy is high.
Buyer guidance: define SLOs for latency and fidelity; choose WebAR vs app per segment; implement attribution with holdouts; and track finance‑grade KPIs monthly (CR lift, return delta, AOV change, asset coverage).
Geography Analysis (Europe & France)
Readiness for AR try‑on is strongest in France, UK, Germany, and the Nordics, driven by robust e‑commerce APIs, 5G/mobile GPU penetration, and mature privacy governance. Italy and Spain ramp as catalog localization and device support improve; Benelux benefits from cross‑border logistics; CEE scales with marketplace growth. The stacked criteria—3D asset depth, mobile GPU/5G, retailer API depth, privacy/compliance, and organizational capability—indicate where AR try‑on can reliably hit production SLAs.
Implications: Stage deployments where API depth and asset pipelines are strongest (France, UK, Germany); localize content and device fallbacks for Southern Europe; and codify consent/telemetry to avoid compliance bottlenecks.

Competitive Landscape (Vendors & Operating Models)
Stacks converge on: (i) 3D asset generation/management; (ii) rendering SDKs (WebAR/app) with device fallbacks; (iii) size/fit engines; (iv) analytics and attribution; and (v) governance for brand, privacy, and accessibility. Differentiators: latency SLAs, asset fidelity (materials/drape), device coverage, and direct PDP publish adapters. System integrators package managed services for mid‑market; enterprises standardize on suites with audit trails and finance‑grade dashboards. Outcome‑indexed pricing—benchmarked to verified CR lift, return‑rate reduction, and AOV uplift—becomes common by 2030 as CFOs require causal proof before scaling budgets.
Report Details
Proceed To Buy
Want a More Customized Experience?
- Request a Customized Transcript: Submit your own questions or specify changes. We’ll conduct a new call with the industry expert, covering both the original and your additional questions. You’ll receive an updated report for a small fee over the standard price.
- Request a Direct Call with the Expert: If you prefer a live conversation, we can facilitate a call between you and the expert. After the call, you’ll get the full recording, a verbatim transcript, and continued platform access to query the content and more.
68 Circular Road, #02-01 049422, Singapore
Revenue Tower, Scbd, Jakarta 12190, Indonesia
4th Floor, Pinnacle Business Park, Andheri East, Mumbai, 400093
Cinnabar Hills, Embassy Golf Links Business Park, Bengaluru, Karnataka 560071
Request Custom Transcript
Related Transcripts

$ 1395


68 Circular Road, #02-01 049422, Singapore
Revenue Tower, Scbd, No.52-53, Jakarta 12190, Indonesia
Cinnabar Hills, Embassy Golf Links Business Park, Bengaluru, Karnataka 560071
4th Floor, Pinnacle Business Park, Andheri East, Mumbai, 400093


68 Circular Road, #02-01 049422, Singapore
Revenue Tower, Scbd, Jakarta 12190, Indonesia
4th Floor, Pinnacle Business Park, Andheri East, Mumbai, 400093
Cinnabar Hills, Embassy Golf Links Business Park, Bengaluru, Karnataka 560071