

68 Circular Road, #02-01 049422, Singapore
Revenue Tower, Scbd, Jakarta 12190, Indonesia
4th Floor, Pinnacle Business Park, Andheri East, Mumbai, 400093
Cinnabar Hills, Embassy Golf Links Business Park, Bengaluru, Karnataka 560071


Connect With Us


68 Circular Road, #02-01 049422, Singapore
Revenue Tower, Scbd, Jakarta 12190, Indonesia
4th Floor, Pinnacle Business Park, Andheri East, Mumbai, 400093
Cinnabar Hills, Embassy Golf Links Business Park, Bengaluru, Karnataka 560071
Connect With Us
68 Circular Road, #02-01 049422, Singapore
Revenue Tower, Scbd, Jakarta 12190, Indonesia
4th Floor, Pinnacle Business Park, Andheri East, Mumbai, 400093
Cinnabar Hills, Embassy Golf Links Business Park, Bengaluru, Karnataka 560071
Request Custom Transcript
AI-Powered Supply Chain Automation in Retail: Operational Risks & Future Innovations
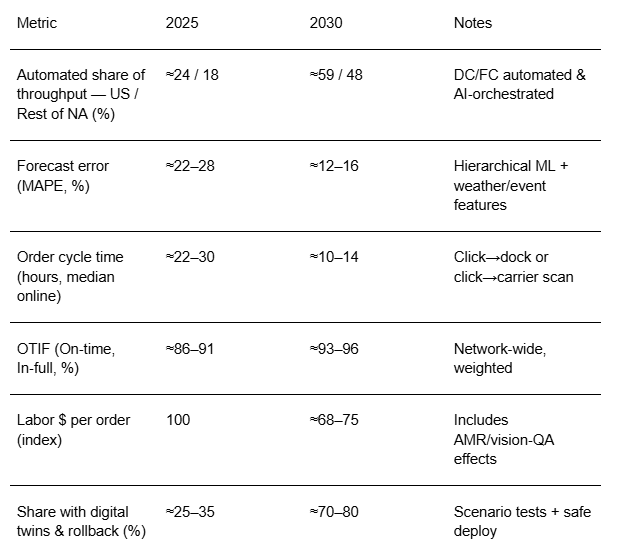
From 2025 to 2030, North American retailers move from pilot islands of automation to AI‑orchestrated networks spanning demand planning, replenishment, fulfillment, and transport. DCs/FCs combine AMRs, goods‑to‑person systems, and computer‑vision QA under a single control plane that ingests orders, inventory, labor, and carrier constraints. Store backrooms adopt light automation for BOPIS and ship‑from‑store, while forecasting and replenishment switch to hierarchical models that learn at SKU‑store‑time and reconcile to finance. Quantitatively, this illustrative outlook shows the share of automated/AI‑orchestrated throughput rising from ~24% to ~59% in US DCs/FCs and from ~18% to ~48% in the rest of North America by 2030.
What's Covered?
Report Summary
Key Takeaways
1. Value peaks when planning, fulfillment, and transport are optimized as one portfolio—not in silos.
2. Digital twins and blue‑green rollouts de‑risk policy changes and peak‑season ramps.
3. AMRs + goods‑to‑person + vision QA lift throughput while lowering labor $/order and error rates.
4. Hierarchical demand models with local signals cut MAPE and smooth bullwhips.
5. Safety systems (zones, stop logic) and human‑factor design are mandatory at scale.
6. Vendor‑agnostic orchestration preserves flexibility and bargaining power.
7. Telemetry SLAs (latency, data freshness) prevent blind decisions during feed outages.
8. Opex models (RaaS/BTaaS) align costs with volume and hedge technology risk.
Key Metrics
Market Size & Share
Automation penetration accelerates as retailers standardize orchestration across DCs/FCs and store backrooms. In this illustrative outlook, the automated share of throughput in US facilities rises from ~24% in 2025 to ~59% by 2030; the rest of North America climbs from ~18% to ~48%. Share concentrates in omni‑fulfillment hubs serving e‑commerce and BOPIS where order‑mix variability and service levels reward AI scheduling and AMR fleets. Store backrooms see selective adoption for ship‑from‑store, with light goods‑to‑person, guided picking, and computer‑vision QC.
Vendor share tilts toward open orchestration that connects WMS/WES with TMS and labor planning, enabling constraint‑aware decisions. Retailers that scale a single control plane gain compounding returns—shorter cycle times, fewer touches, and better OTIF while those running siloed pilots see benefits stall at the site level.

Market Analysis
KPI improvements materialize when planning, fulfillment, and transport are optimized jointly. In this composite index view (2025→2030), forecasting drives the largest MAPE reduction, fulfillment delivers the biggest cycle‑time and labor gains via AMRs/goods‑to‑person/vision QA, while replenishment and transportation contribute to OTIF and cycle stability. Cost drivers include integration engineering, safety systems, and change management; benefits include higher throughput per square foot, fewer exceptions, and better delivery promises.
Risks include model drift around events/promo seasons, feed outages that blind schedulers, and operational congestion (queue starvation, blocked aisles). Mitigations: digital‑twin stress tests, priority queues with aging policies, buffer design, and conservative fallbacks. Finance teams will require attribution that separates automation benefit from demand mix and promo noise.

Trends & Insights (2025–2030)
• Digital twins simulate labor, AMR fleets, and dock schedules before peak; blue‑green deploys lower incident risk.
• Vision‑AI QC reduces defects and supports lightweight compliance on labeling/packaging.
• Edge AI runs on-site for latency‑critical routing while control planes coordinate cross‑site policies.
• Slotting and inventory placement become dynamic, driven by short‑horizon forecasts and clickstream signals.
• Yard automation (gate OCR, autonomous yard trucks) removes upstream bottlenecks.
• Safety: ISO/ANSI robotics standards and zoned speed limits; human‑factor design for pick stations.
• Vendor‑agnostic orchestration layers standardize adapters and protect against lock‑in.
• Opex models (RaaS/BTaaS) align spend to volume, easing board approvals.
Segment Analysis
• Grocery: temperature and freshness constraints; high‑velocity SKUs benefit from dynamic slotting and AMR replenishment; tight OTIF targets.
• Apparel: high SKU variety; vision QA for barcode/size/color; backroom automation for BOPIS and returns triage.
• Consumer Electronics: high value, anti‑theft and serial tracking; careful handling workflows.
• Home/DIY: bulky items; mixed‑case automation and yard coordination matter.
Buyer guidance: map flows to technologies (AMR, shuttle, goods‑to‑person); prioritize nodes with measurable cycle‑time and OTIF gains; and ensure telemetry SLAs and safety compliance precede scale.
Geography Analysis (North America)
Readiness clusters in the US Northeast and West given data talent and vendor ecosystems; the South and Midwest gain with manufacturing/logistics corridors and power availability. Ontario/Quebec benefit from governance and industrial bases; Western Canada and Northern Mexico scale as cross‑border fulfillment deepens. The stacked criteria—data & telemetry, automation vendors, labor/training, infrastructure/power, and policy/grants—indicate where production SLAs for automation are most feasible.
Implications: stage deployments where data quality and vendor density are highest; codify safety and data governance; and use modular financing to hedge technology and demand volatility.

Competitive Landscape (Platforms & Operating Models)
Stacks converge on: (i) planning (demand/replenishment), (ii) orchestration (WMS/WES with AMR/ASRS control), (iii) transport & yard automation, and (iv) telemetry/observability. Differentiators: safety certifications, adapter breadth for robots and ASRS, latency SLAs, and digital‑twin fidelity. System integrators bundle turnkey deployments; enterprises seek vendor‑agnostic control planes. Contracting shifts to outcomes indexed to cycle‑time, OTIF, and labor $/order with uptime SLAs. Winners publish incident postmortems, maintain audit trails, and demonstrate portable ROI across sites.
Report Details
Proceed To Buy
Want a More Customized Experience?
- Request a Customized Transcript: Submit your own questions or specify changes. We’ll conduct a new call with the industry expert, covering both the original and your additional questions. You’ll receive an updated report for a small fee over the standard price.
- Request a Direct Call with the Expert: If you prefer a live conversation, we can facilitate a call between you and the expert. After the call, you’ll get the full recording, a verbatim transcript, and continued platform access to query the content and more.
68 Circular Road, #02-01 049422, Singapore
Revenue Tower, Scbd, Jakarta 12190, Indonesia
4th Floor, Pinnacle Business Park, Andheri East, Mumbai, 400093
Cinnabar Hills, Embassy Golf Links Business Park, Bengaluru, Karnataka 560071
Request Custom Transcript
Related Transcripts

$ 1395


68 Circular Road, #02-01 049422, Singapore
Revenue Tower, Scbd, No.52-53, Jakarta 12190, Indonesia
Cinnabar Hills, Embassy Golf Links Business Park, Bengaluru, Karnataka 560071
4th Floor, Pinnacle Business Park, Andheri East, Mumbai, 400093


68 Circular Road, #02-01 049422, Singapore
Revenue Tower, Scbd, Jakarta 12190, Indonesia
4th Floor, Pinnacle Business Park, Andheri East, Mumbai, 400093
Cinnabar Hills, Embassy Golf Links Business Park, Bengaluru, Karnataka 560071