

68 Circular Road, #02-01 049422, Singapore
Revenue Tower, Scbd, Jakarta 12190, Indonesia
4th Floor, Pinnacle Business Park, Andheri East, Mumbai, 400093
Cinnabar Hills, Embassy Golf Links Business Park, Bengaluru, Karnataka 560071


Connect With Us


68 Circular Road, #02-01 049422, Singapore
Revenue Tower, Scbd, Jakarta 12190, Indonesia
4th Floor, Pinnacle Business Park, Andheri East, Mumbai, 400093
Cinnabar Hills, Embassy Golf Links Business Park, Bengaluru, Karnataka 560071
Connect With Us
68 Circular Road, #02-01 049422, Singapore
Revenue Tower, Scbd, Jakarta 12190, Indonesia
4th Floor, Pinnacle Business Park, Andheri East, Mumbai, 400093
Cinnabar Hills, Embassy Golf Links Business Park, Bengaluru, Karnataka 560071
Request Custom Transcript
AI-Powered Retail Media Optimization: Bid Strategy Automation & Creative Personalization at Scale
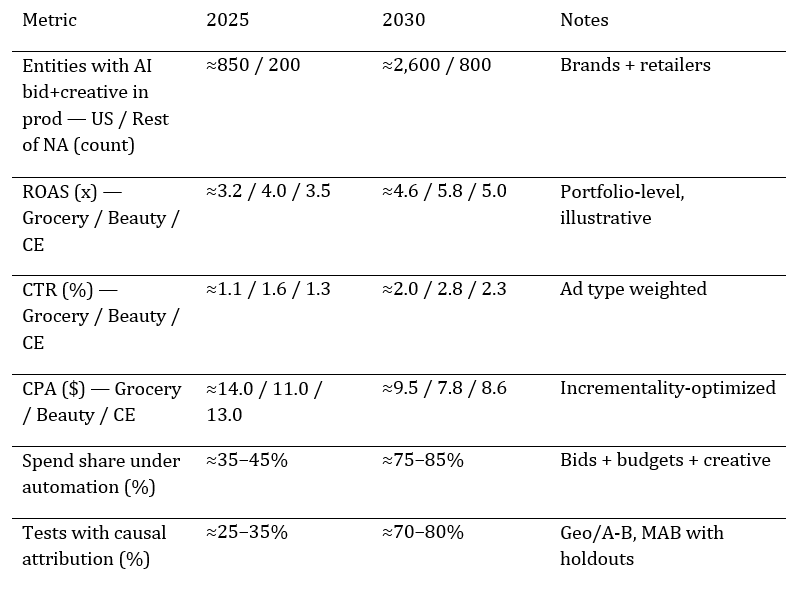
From 2025 to 2030, retail media shifts from channel‑by‑channel buying to AI‑orchestrated portfolios where bids, budgets, and creative variants adapt in near real time to demand, inventory, and competition. Bid automation blends econometrics (incrementality, elasticity) with reinforcement learning to allocate spend across keywords, product ads, and on‑site display. Creative personalization pulls aspect‑level signals from reviews and search queries to generate copy and image variants under brand guardrails. Activation occurs through direct RMN APIs and clean rooms linking first‑party IDs with retailer audiences. Quantitatively, this illustrative outlook shows North American adopters of production‑grade AI retail‑media stacks growing from ~1,050 entities in 2025 to ~3,400 by 2030 (US ~850→~2,600; rest of NA ~200→~800).
What's Covered?
Report Summary
Key Takeaways
1. Causal lift (incrementality),not last‑click ROAS, should steer budget and creative.
2. Guardrails for bids and creatives (inventory, price, MAP, brand voice) prevent runaway policies.
3. Creative variants built from aspect‑level sentiment double CTR when QA and accessibility are enforced.
4. Clean‑room audiences and first‑party ID graphs future‑proof targeting under privacy constraints.
5. Retail media + organic search should be optimized jointly; siloed tactics waste spend.
6. Telemetry must include contribution margin and stock‑out penalties, not just revenue.
7. Dynamic pacing with crash‑stops protects budgets during feed/API outages or price shocks.
8. Outcome‑based contracts indexed to verified lift will dominate vendor selection.
Key Metrics
Market Size & Share
AI adoption in retail media mirrors two forces: the rise of retailer first‑party audiences and the maturation of creative ops that can supply compliant variants on demand. In this illustrative view, US entities in production rise from ~850 to ~2,600 by 2030; the rest of North America from ~200 to ~800. Early share concentrates in Beauty and CPG where audience signals and repeat purchase enable fast learning; Consumer Electronics ramps as MAP constraints loosen and feed quality improves. Platform share tilts toward RMNs with deep APIs, robust audience taxonomies, and match back services; vendors that bundle bid automation with creative decisioning gain lift by compressing feedback loops.
By 2030, the market coalesces around portfolio optimizers that stitch together onsite search, display, and sponsored product ads across RMNs, search, and social. Winners expose clear incrementality metrics and enable day‑parting, geo‑testing, and audience recycling with privacy guardrails. The moat becomes data contracts, API depth, and attribution credibility—not UI features alone.

Market Analysis
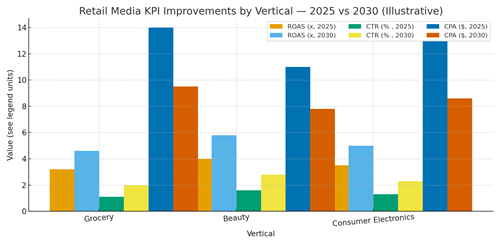
KPI deltas arise when bids, budgets, and creatives are optimized as one portfolio. In this outlook, ROAS climbs from ~3.2–4.0× to ~4.6–5.8× as portfolios re‑weight spend to audiences and keywords with proven incremental lift; CTR doubles as creative variants match aspect‑level intent; CPA falls ~25–40% as waste is culled. Cost drivers include data licensing (audience/clean room fees), creative production/QA, and engineering for real‑time bidding and monitoring. Benefits include higher contribution margin, reduced media waste, and fewer stock‑out‑induced inefficiencies from uncoordinated campaigns.
Risks: feed delays and API outages; brand‑safety/compliance issues in generated creative; over‑spend from feedback‑loop errors; and cannibalization across channels. Mitigations: crash‑stops and budget caps; brand voice templates and accessibility checks; cross‑channel portfolio constraints; and always‑on geo/A‑B tests for ground truth. RoI credibility depends on finance‑grade attribution with holdouts and causal inference not proxy metrics.
Trends & Insights (2025–2030)
• Causal bidding becomes standard: portfolios optimize to geo/A‑B lift and contribution margin, not last‑click.
• Creative factories: templated copy/images generated from aspect‑level sentiment; strict QA and claims checks.
• Clean rooms link first‑party IDs with retailer audiences; privacy‑preserving measurements replace raw log swaps.
• Multi‑objective pacing: guardrails for inventory, MAP, and price; crash‑stops during anomalies.
• Retail media converges with search/social; portfolio optimizers coordinate auctions to avoid cannibalization.
• Real‑time diagnostics: feed health, sale price mismatches, and OOS alerts tie to bidding and creative.
• Accessibility and brand‑safety gates become non‑negotiable pre‑publish checks.
• Outcome‑based contracts: vendor fees indexed to verified incremental revenue and SLA adherence.
Segment Analysis
• CPG/Grocery: short purchase cycles; optimize frequency caps and basket‑level incrementality; creative focuses on pack size, freshness, and value.
• Beauty/Personal Care: sentiment‑driven creative (shade/texture); high ROAS potential; strict claims substantiation and image QA.
• Consumer Electronics: longer cycles; MAP constraints; value‑based creative and bundle offers; emphasize compatibility and availability.
• Home/DIY: seasonal peaks; local inventory signals; how‑to creative and project bundles.
Buyer guidance: set category‑specific ROAS/CPA targets; enforce guardrails (inventory, MAP); ensure clean‑room readiness; and run continuous holdouts to manage attribution risk.
Geography Analysis (North America)
Readiness clusters in the US Northeast and West (dense RMNs, data talent, and API‑mature retailers), followed by the South and Midwest as clean‑room adoption and first‑party ID graphs scale. Ontario/Quebec benefit from strong data governance and retailer networks; Western Canada and Northern Mexico add growth through cross‑border commerce. The stacked criteria—RMN maturity, data/ID graphs, API/activation depth, compliance/privacy, and organization capability—indicate where AI‑driven retail media can achieve production SLAs first.
Implications: stage deployments where API depth and audience taxonomies are richest; negotiate clean‑room terms early; and implement portfolio guardrails to coordinate retail media with search and social.

Competitive Landscape (Platforms & Operating Models)
Stacks converge on: (i) bid automation with causal attribution; (ii) creative decisioning and templated generation under guardrails; (iii) clean‑room audience building and sales match back; and (iv) monitoring/telemetry. Differentiators: latency SLAs, attribution rigor with holdouts, API coverage across RMNs, and creative QA/governance. System integrators bundle managed services for mid‑market brands; enterprises run control planes in‑house while sourcing audience and creative services from partners. Outcome‑indexed pricing (verified incremental revenue, ROAS lift within CPA bounds) becomes common. Winners publish audit trails, safeguard brand and accessibility, and operate portfolios that coordinate search/social with RMNs to maximize contribution margin while minimizing cannibalization.
Report Details
Proceed To Buy
Want a More Customized Experience?
- Request a Customized Transcript: Submit your own questions or specify changes. We’ll conduct a new call with the industry expert, covering both the original and your additional questions. You’ll receive an updated report for a small fee over the standard price.
- Request a Direct Call with the Expert: If you prefer a live conversation, we can facilitate a call between you and the expert. After the call, you’ll get the full recording, a verbatim transcript, and continued platform access to query the content and more.
68 Circular Road, #02-01 049422, Singapore
Revenue Tower, Scbd, Jakarta 12190, Indonesia
4th Floor, Pinnacle Business Park, Andheri East, Mumbai, 400093
Cinnabar Hills, Embassy Golf Links Business Park, Bengaluru, Karnataka 560071
Request Custom Transcript
Related Transcripts

$ 1395


68 Circular Road, #02-01 049422, Singapore
Revenue Tower, Scbd, No.52-53, Jakarta 12190, Indonesia
Cinnabar Hills, Embassy Golf Links Business Park, Bengaluru, Karnataka 560071
4th Floor, Pinnacle Business Park, Andheri East, Mumbai, 400093


68 Circular Road, #02-01 049422, Singapore
Revenue Tower, Scbd, Jakarta 12190, Indonesia
4th Floor, Pinnacle Business Park, Andheri East, Mumbai, 400093
Cinnabar Hills, Embassy Golf Links Business Park, Bengaluru, Karnataka 560071