

68 Circular Road, #02-01 049422, Singapore
Revenue Tower, Scbd, Jakarta 12190, Indonesia
4th Floor, Pinnacle Business Park, Andheri East, Mumbai, 400093
Cinnabar Hills, Embassy Golf Links Business Park, Bengaluru, Karnataka 560071


Connect With Us


68 Circular Road, #02-01 049422, Singapore
Revenue Tower, Scbd, Jakarta 12190, Indonesia
4th Floor, Pinnacle Business Park, Andheri East, Mumbai, 400093
Cinnabar Hills, Embassy Golf Links Business Park, Bengaluru, Karnataka 560071
Connect With Us
68 Circular Road, #02-01 049422, Singapore
Revenue Tower, Scbd, Jakarta 12190, Indonesia
4th Floor, Pinnacle Business Park, Andheri East, Mumbai, 400093
Cinnabar Hills, Embassy Golf Links Business Park, Bengaluru, Karnataka 560071
Request Custom Transcript
AI-Powered Healthcare Diagnostics: Market Segmentation & Regulatory Compliance in Cloud-Based Systems
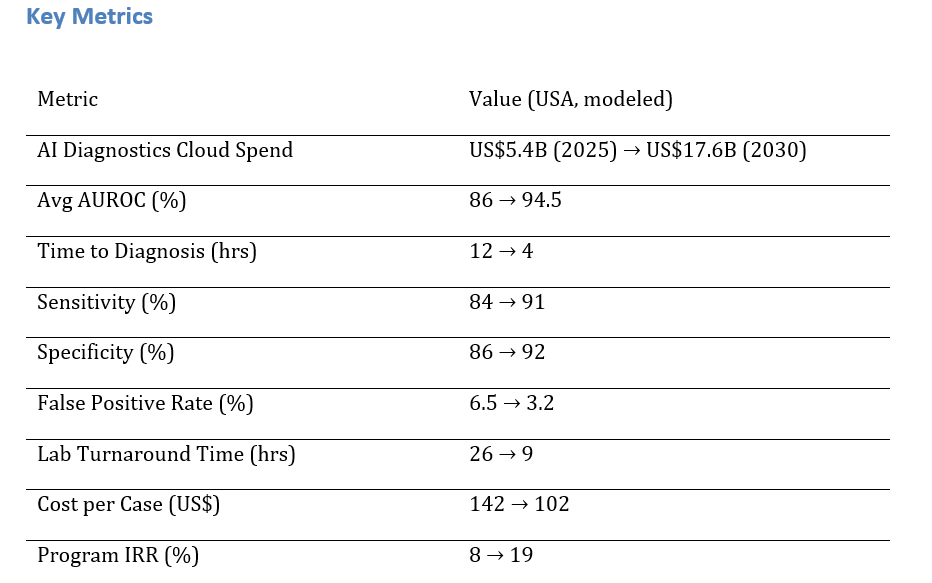
US healthcare providers and labs are expanding AI-powered diagnostics on cloud platforms to enhance accuracy, speed, and access. Market spend is expected to rise from ~$5.4B in 2025 to ~$17.6B by 2030 as imaging, pathology, and cardiology workflows move to secure, compliant clouds. Diagnostic AUROC improves from 86% to 94.5%, sensitivity from 84% to 91%, and specificity from 86% to 92%. Time-to-diagnosis drops from 12 to 4 hours, lab turnaround from 26 to 9 hours, and cost per case from $142 to $102. The architecture includes de-identified data lakes and bias-monitored model ops. AI-driven diagnostics will deliver faster, more accurate, and cost-effective care while meeting HIPAA and FDA standards.

What's Covered?
Report Summary
Key Takeaways
1. Multimodal models raise AUROC by fusing imaging, labs, and EHR context.
2. AI triage prioritizes high-risk studies, reducing time to diagnosis in acute care.
3. Continuous calibration and QA lower false positives while preserving sensitivity.
4. Cloud-native pipelines expand access to subspecialty reads for rural sites.
5. Regulatory-ready model ops: versioning, bias monitoring, and post-market surveillance.
6. De-identification and consent orchestration protect privacy while enabling scale.
7. Automated documentation streamlines prior auth and supports payer compliance.
8. C‑suite dashboard: AUROC, sensitivity/specificity, FPR, TAT, $/case, IRR.
a) Market Size & Share
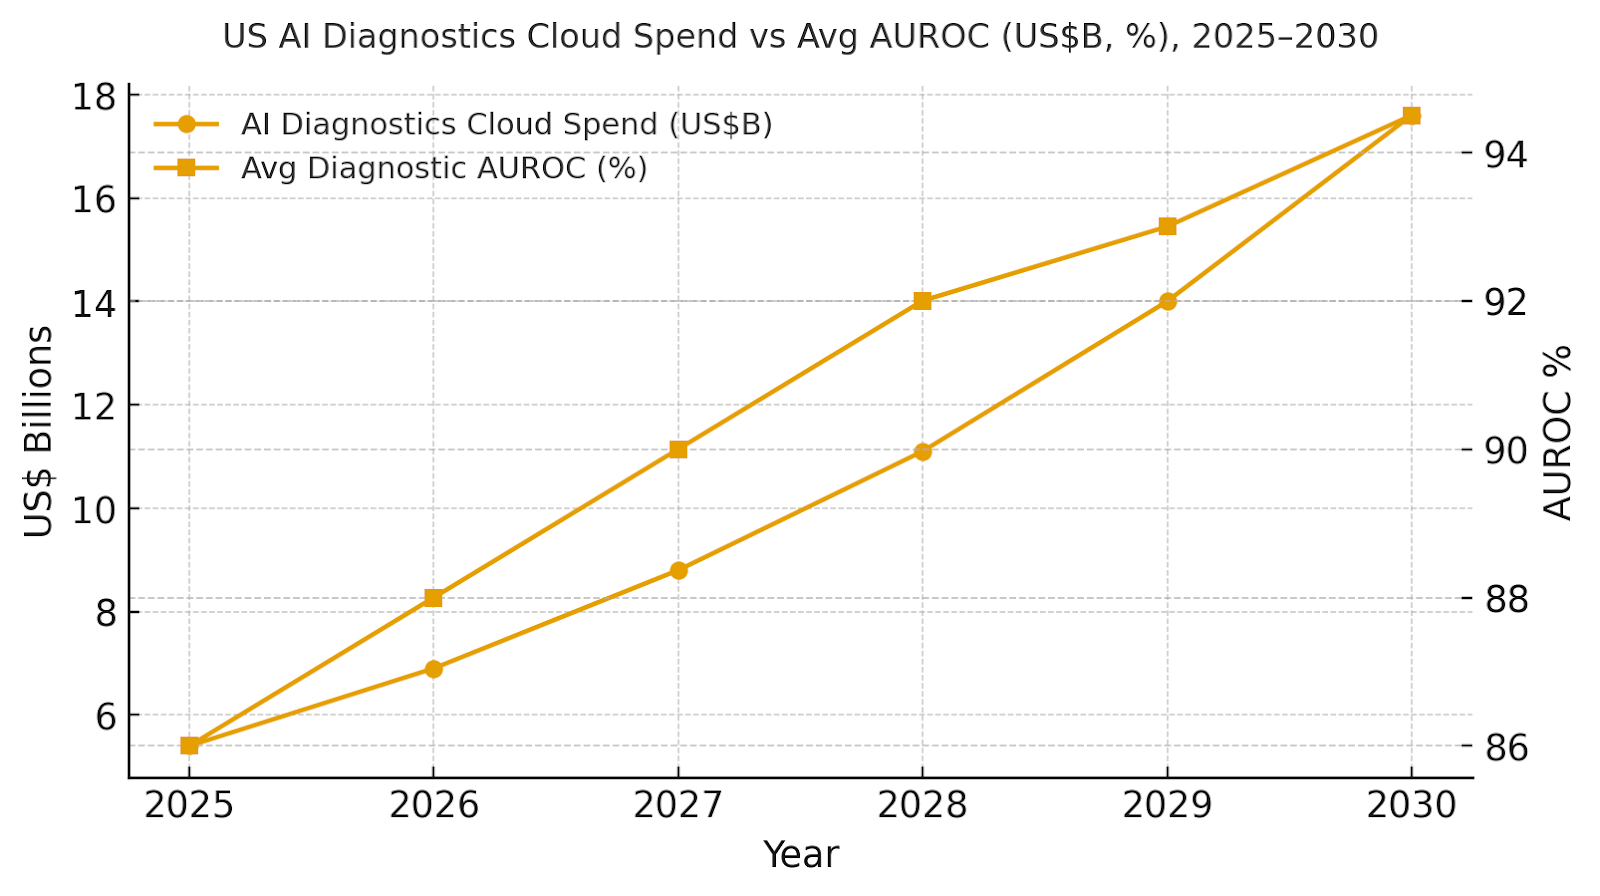
US AI diagnostics cloud spend is modeled to grow from ~US$5.4B to ~US$17.6B (2025–2030) as health systems migrate imaging, pathology, and cardiology workflows to secure cloud platforms with scalable model ops. The dual‑axis figure shows spend rising with mean AUROC improving from ~86% to ~94.5%. Share accrues to vendors with multimodal capabilities, native integrations (PACS/VNA, LIS, EHR), and regulatory tooling. Execution risks: data silos, image protocol variability, and compute cost spikes; mitigations: standardized pipelines, compression, and reserved capacity. Share tracking should weigh AUROC, sensitivity/specificity, FPR, TAT, $/case, and IRR.
b) Market Analysis
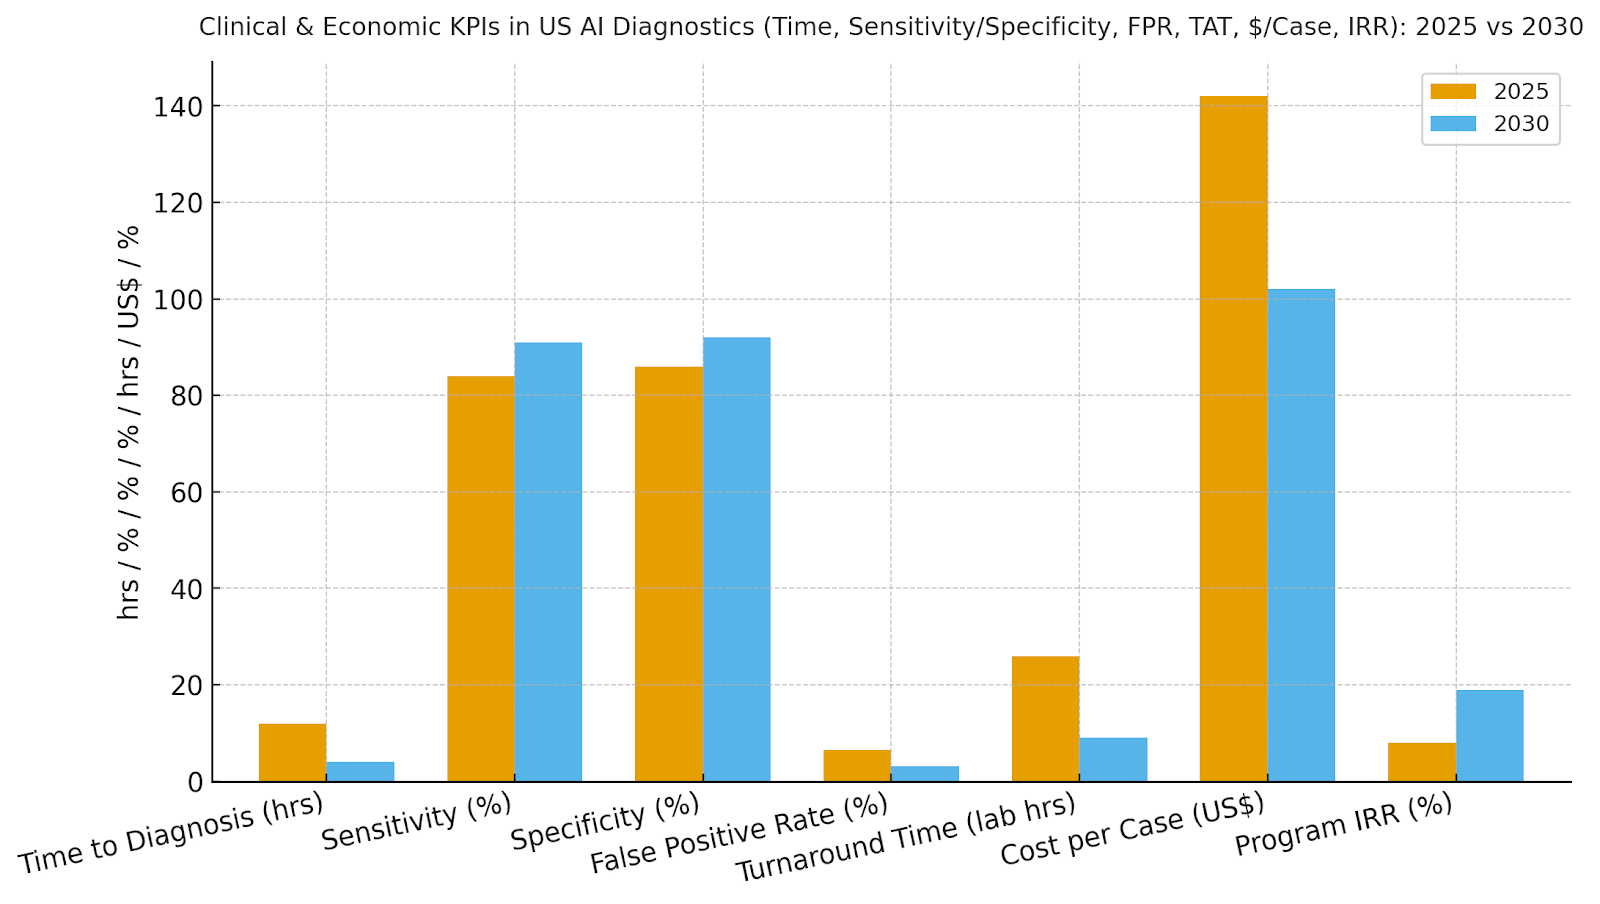
Our model shows time-to-diagnosis compressing ~67%, sensitivity up ~7 points, specificity up ~6 points, and false positives cut by half—driving fewer unnecessary follow-ups and faster initiation of care. Lab TAT improves from ~26 to ~9 hours with automation, and $/case drops ~28%. IRR grows ~8→~19% as throughput and quality compound. Enablers: de-identified data lakes, MLOps with drift/bias monitoring, and clinician-in-the-loop review. Barriers: credentialing and change management, heterogeneous scanners/protocols, and payer documentation gaps. Financial lens: quantify avoided transfers, shortened length of stay, and reduced read repeats. The bar figure summarizes KPI shifts for disciplined programs.
c) Trends & Insights
1) Multimodal diagnostics (image+text+signals) become baseline; large vision-language models add reasoning and explainability. 2) Federated learning and TEEs support cross-institution training without moving PHI. 3) AI triage governs worklists to reduce door‑to‑needle times for stroke and sepsis. 4) Digital pathology at scale drives standardization and second‑opinion access. 5) Bias monitoring shifts from static to continuous with outcome‑based calibration. 6) SaMD lifecycle management aligns with FDA MLMD guidance, including change control plans. 7) Prior authorization automation pairs evidence extraction with payer rules. 8) Sustainability dashboards track compute intensity per study with carbon‑aware scheduling. 9) Patient‑facing explainability increases trust and adherence. 10) Benchmarks move beyond AUROC to clinical utility metrics (NNB, NNT, LoS impact).
d) Segment Analysis
Hospitals/IDNs: stroke/sepsis/trauma pathways with 24/7 triage; deep PACS/EHR integration. Imaging Centers: throughput and quality standardization; remote subspecialty reads. Labs/Pathology: digital pathology pipelines, stain normalization, and automated QA. Telehealth/Triage: symptom triage and RPM early warning for deterioration. Payers: prior-auth automation and fraud/waste/abuse detection. Across segments, track AUROC, sensitivity/specificity, FPR, TAT, $/case, and IRR; align thresholds to clinical risk.
e) Geography Analysis
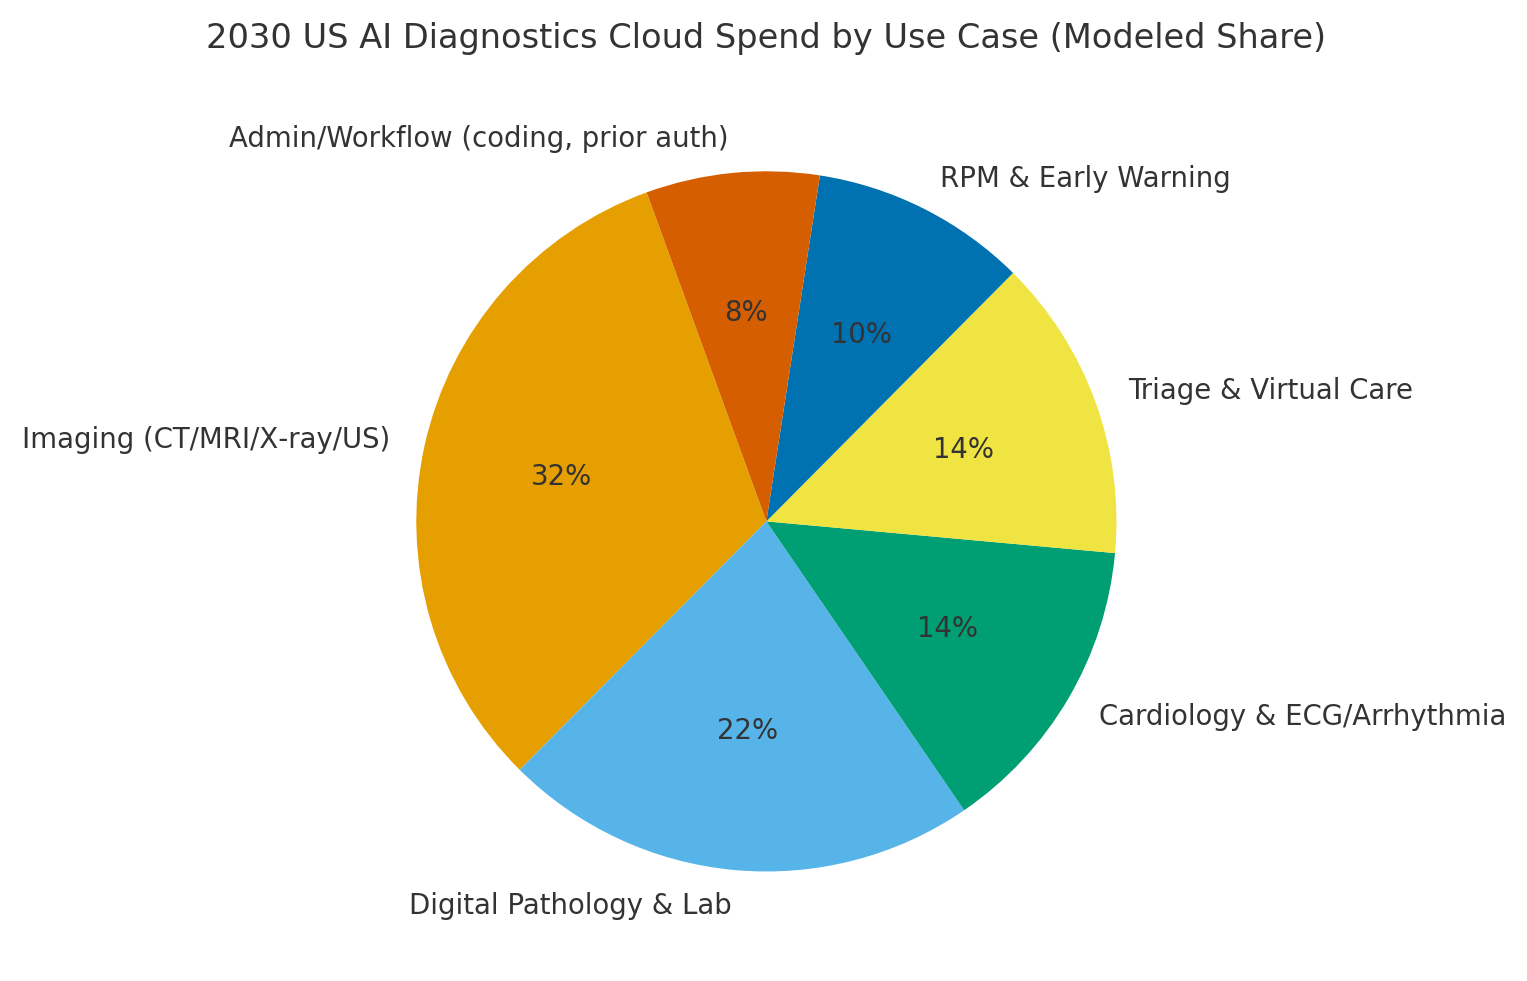
By 2030, we model US spend/use‑case mix as Imaging (~32%), Digital Pathology & Lab (~22%), Cardiology (~14%), Triage & Virtual Care (~14%), RPM & Early Warning (~10%), and Admin/Workflow (~8%). The pie figure reflects the mix. Urban hubs drive imaging and pathology scale; rural networks lean on cloud triage and remote reads. Execution: deploy de‑identification and consent orchestration, standardize pipelines, and publish KPI dashboards with bias and drift indicators.
f) Competitive Landscape
Competition spans imaging AI vendors, cloud platform providers, digital pathology players, and EHR/PACS incumbents. Differentiation vectors: (1) multimodal model performance and generalization, (2) regulatory tooling and post‑market surveillance, (3) integration depth (PACS/VNA, LIS, EHR), (4) explainability and bias dashboards, and (5) time‑to‑value and support. Procurement guidance: require open APIs, exportable evidence packages, SaMD change-control plans, and SLAs tied to clinical metrics. Competitive KPIs: AUROC, sensitivity/specificity, FPR, TAT, $/case, IRR uplift.
Report Details
Proceed To Buy
Want a More Customized Experience?
- Request a Customized Transcript: Submit your own questions or specify changes. We’ll conduct a new call with the industry expert, covering both the original and your additional questions. You’ll receive an updated report for a small fee over the standard price.
- Request a Direct Call with the Expert: If you prefer a live conversation, we can facilitate a call between you and the expert. After the call, you’ll get the full recording, a verbatim transcript, and continued platform access to query the content and more.
68 Circular Road, #02-01 049422, Singapore
Revenue Tower, Scbd, Jakarta 12190, Indonesia
4th Floor, Pinnacle Business Park, Andheri East, Mumbai, 400093
Cinnabar Hills, Embassy Golf Links Business Park, Bengaluru, Karnataka 560071
Request Custom Transcript
Related Transcripts

$ 1350

68 Circular Road, #02-01 049422, Singapore
Revenue Tower, Scbd, No.52-53, Jakarta 12190, Indonesia
Cinnabar Hills, Embassy Golf Links Business Park, Bengaluru, Karnataka 560071
4th Floor, Pinnacle Business Park, Andheri East, Mumbai, 400093


68 Circular Road, #02-01 049422, Singapore
Revenue Tower, Scbd, Jakarta 12190, Indonesia
4th Floor, Pinnacle Business Park, Andheri East, Mumbai, 400093
Cinnabar Hills, Embassy Golf Links Business Park, Bengaluru, Karnataka 560071