

68 Circular Road, #02-01 049422, Singapore
Revenue Tower, Scbd, Jakarta 12190, Indonesia
4th Floor, Pinnacle Business Park, Andheri East, Mumbai, 400093
Cinnabar Hills, Embassy Golf Links Business Park, Bengaluru, Karnataka 560071


Connect With Us


68 Circular Road, #02-01 049422, Singapore
Revenue Tower, Scbd, Jakarta 12190, Indonesia
4th Floor, Pinnacle Business Park, Andheri East, Mumbai, 400093
Cinnabar Hills, Embassy Golf Links Business Park, Bengaluru, Karnataka 560071
Connect With Us
68 Circular Road, #02-01 049422, Singapore
Revenue Tower, Scbd, Jakarta 12190, Indonesia
4th Floor, Pinnacle Business Park, Andheri East, Mumbai, 400093
Cinnabar Hills, Embassy Golf Links Business Park, Bengaluru, Karnataka 560071
Request Custom Transcript
AI-Powered Digital Shelf Analytics: Competitor Benchmarking & Conversion Rate Optimization
From 2025 to 2030, digital shelf analytics (DSA) becomes the control tower for commerce decisions across search, retail media, and PDP optimization. What began as weekly dashboards evolves into near‑real‑time benchmarking of rank, price, availability, ratings, and media signals wired directly into content, promo, and supply actions. For manufacturers, DSA exposes competitor gaps and retail execution issues (out‑of‑stocks, broken variants, incomplete attributes). For retailers, it powers assortment, pricing, and on‑site merchandising while enforcing governance on third‑party sellers.

What's Covered?
Report Summary
Key Takeaways
1. DSA value peaks when rank, price, availability, and reviews feed one ‘share‑of‑shelf’ objective.
2. Attribution must prove which fixes changed conversion and rank—else ROI stalls in pilots.
3. Product graph hygiene and variant logic are prerequisites for reliable benchmarking.
4. Automated anomaly detection (broken PDPs, OOS risk) saves more $ than manual policing.
5. Retail media + organic search should be optimized jointly; siloed tactics waste spend.
6. Governance (claims, brand voice, accessibility) prevents AI‑induced compliance risk.
7. API depth with retailers determines how ‘real‑time’ your actions can be.
8. Telemetry and audit trails are essential for finance sign‑off and scalable operations.
Key Metrics

Market Size & Share
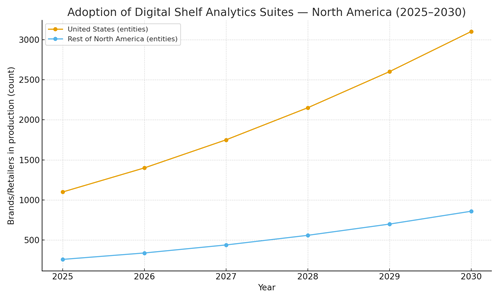
DSA adoption tracks two dynamics: the growth of retail media and the maturation of product‑graph governance. In this illustrative outlook, US brands and retailers running production DSA suites expand from ~1,100 (2025) to ~3,100 (2030), while the rest of North America grows from ~260 to ~860. Early share accrues to CPG and Beauty due to high SKU churn and promotional cadence; Consumer Electronics lifts steadily as MAP policies loosen and compatibility content structures improve. For manufacturers, market share is won when shelf gaps are closed faster than competitors; for retailers, share is defended by enforcement of PDP standards and buy‑box integrity across third‑party sellers.
By 2030, DSA platforms converge around unified share‑of‑shelf scoring that blends organic rank, paid placements, availability, reviews, and price/value signals. Vendors with broad endpoint coverage and direct publishing hooks gain disproportionate share as analytics directly trigger actions—content updates, promo tuning, and inventory rebalancing—within hours. The practical moat becomes data contracts, API depth, and attribution credibility, not just dashboards.
Market Analysis
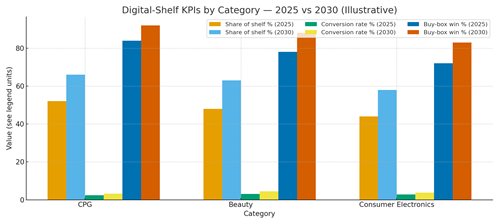
Operationalizing analytics into actions drives the KPI shifts. In this outlook, category share‑of‑shelf indexes rise by ~10–15 points as OOS monitoring and rank‑aware media bidding are wired into playbooks; buy‑box win rates jump ~8–11 points as enforcement and price/availability alerts close gaps; and PDP conversion lifts ~0.8–1.3 pp with image/attribute completeness and review‑driven copy fixes. Cost drivers include data licensing (rank, price, availability, reviews), integration engineering, and governance time. Benefits include higher organic traffic, reduced media waste, fewer returns from attribute parity, and stronger brand value perception.
Risks: data sparsity for long‑tail SKUs; broken variant mapping; inconsistent retailer APIs; and compliance issues with generated content. Mitigations: product‑graph MDM; schema validation; synthetic tests for change safety; and fallbacks when retailer publishing is delayed. RoI proof requires finance‑grade attribution that isolates the impact of content fixes versus media spend and supply improvements.
Trends & Insights (2025–2030)
• Unified ‘share of shelf’ scoring becomes the north star, combining paid and organic visibility with availability.
• Aspect‑level review sentiment pinpoints attribute fixes that most move conversion by category.
• Automated anomaly monitors detect broken PDPs, missing images, and OOS risk before rank erodes.
• Attribution evolves to causal methods (geo/A‑B) with media and content budgets tied to verified lift.
• Retailer APIs standardize; direct‑publish adapters cut latency to hours; image/attribute QA gates prevent errors.
• Privacy/claims governance and accessibility checks are default steps before publish.
• Org models shift to ‘merch ops’ pods that pair data analysts with content ops and supply planners.
• Vendor consolidation accelerates; suites integrate competitive data, content decisioning, and publish tooling.
Segment Analysis
• CPG: high SKU churn and promo cadence; focus on OOS detection, rank‑aware bidding, and image/attribute completeness.
• Beauty/Personal Care: conversion most sensitive to review sentiment (fragrance/texture) and image hygiene; invest in shade finders and regimen bundles.
• Consumer Electronics: buy‑box integrity and compatibility content dominate; Q&A mining closes spec gaps; MAP constraints require value‑based positioning.
• Home/DIY: seasonal content and how‑to guides; local compatibility and inventory signals; heavy reliance on imagery.
Buyer guidance: prioritize categories with measurable elasticity to visibility and content fixes; lock data contracts for rank, price, reviews, availability; define SLAs for publish latency and anomaly resolution; and run continuous tests to earn finance approval for scaled spend.
Geography Analysis (North America)
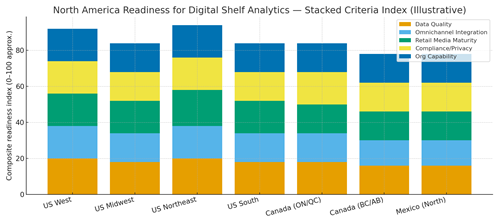
Readiness clusters in the US Northeast and West dense with data talent, retail‑tech vendors, and high‑API retailers followed by the South and Midwest as omnichannel data quality improves. Ontario/Quebec benefit from governance expertise and marketplace presence; Western Canada and Northern Mexico gain traction as cross‑border retail scales. The stacked criteria data quality, omnichannel integration, retail media maturity, compliance/privacy, and organization capability signal where closed‑loop DSA can reach production SLAs first.
Implications: stage rollouts where product‑graph and API depth are strongest; negotiate comprehensive data feeds for rank, price, reviews, and availability; and codify governance to prevent compliance slipups as automation accelerates.
Competitive Landscape (Platforms & Operating Models)
Stacks converge on four layers: (i) competitive data (rank, price, reviews, availability); (ii) analytics and anomaly detection; (iii) decisioning that recommends actions; and (iv) publish adapters/API connectors to retailers and marketplaces. Differentiators are endpoint coverage, latency SLAs, attribution rigor, and governance tooling. System integrators package managed services for mid‑market brands and retailers; enterprises mix in‑house analytics with vendor data and adapters. Outcome‑based pricing indexed to verified share‑of‑shelf gains and conversion lift becomes common. Winners demonstrate closed‑loop playbooks (detect→decide→publish→measure) with audit trails, enabling CFO‑grade confidence to scale investments through 2030.
Report Details
Proceed To Buy
Want a More Customized Experience?
- Request a Customized Transcript: Submit your own questions or specify changes. We’ll conduct a new call with the industry expert, covering both the original and your additional questions. You’ll receive an updated report for a small fee over the standard price.
- Request a Direct Call with the Expert: If you prefer a live conversation, we can facilitate a call between you and the expert. After the call, you’ll get the full recording, a verbatim transcript, and continued platform access to query the content and more.
68 Circular Road, #02-01 049422, Singapore
Revenue Tower, Scbd, Jakarta 12190, Indonesia
4th Floor, Pinnacle Business Park, Andheri East, Mumbai, 400093
Cinnabar Hills, Embassy Golf Links Business Park, Bengaluru, Karnataka 560071
Request Custom Transcript
Related Transcripts

$ 1395


68 Circular Road, #02-01 049422, Singapore
Revenue Tower, Scbd, No.52-53, Jakarta 12190, Indonesia
Cinnabar Hills, Embassy Golf Links Business Park, Bengaluru, Karnataka 560071
4th Floor, Pinnacle Business Park, Andheri East, Mumbai, 400093


68 Circular Road, #02-01 049422, Singapore
Revenue Tower, Scbd, Jakarta 12190, Indonesia
4th Floor, Pinnacle Business Park, Andheri East, Mumbai, 400093
Cinnabar Hills, Embassy Golf Links Business Park, Bengaluru, Karnataka 560071