

68 Circular Road, #02-01 049422, Singapore
Revenue Tower, Scbd, Jakarta 12190, Indonesia
4th Floor, Pinnacle Business Park, Andheri East, Mumbai, 400093
Cinnabar Hills, Embassy Golf Links Business Park, Bengaluru, Karnataka 560071


Connect With Us


68 Circular Road, #02-01 049422, Singapore
Revenue Tower, Scbd, Jakarta 12190, Indonesia
4th Floor, Pinnacle Business Park, Andheri East, Mumbai, 400093
Cinnabar Hills, Embassy Golf Links Business Park, Bengaluru, Karnataka 560071
Connect With Us
68 Circular Road, #02-01 049422, Singapore
Revenue Tower, Scbd, Jakarta 12190, Indonesia
4th Floor, Pinnacle Business Park, Andheri East, Mumbai, 400093
Cinnabar Hills, Embassy Golf Links Business Park, Bengaluru, Karnataka 560071
Request Custom Transcript
AI-Powered Agricultural Analytics: Cloud-Based Crop Prediction & Sustainability Impact
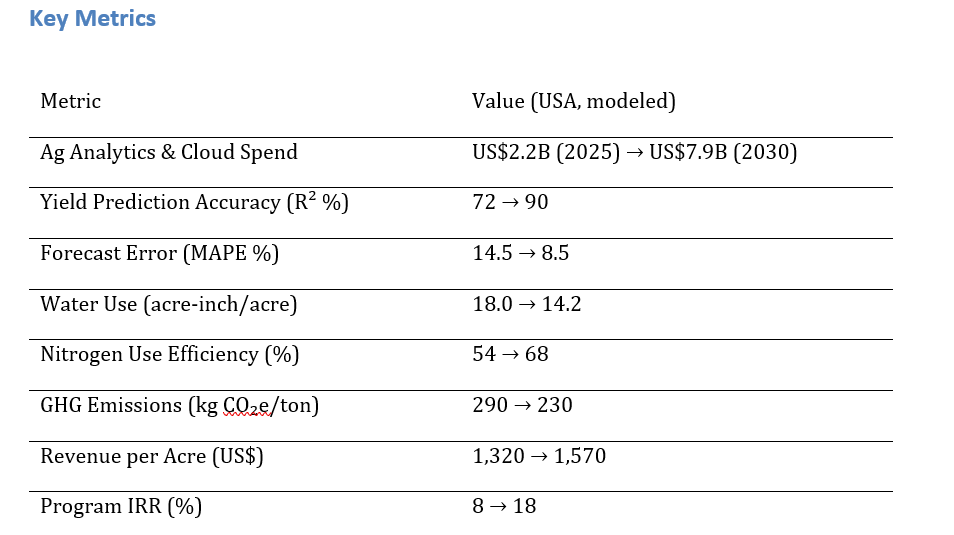
US agriculture is transitioning to data-driven operations powered by AI and cloud analytics. Market spend on AI agronomic platforms is expected to rise from ~$2.2B in 2025 to ~$7.9B by 2030. Yield prediction accuracy will improve from 72% to 90%, while forecast error drops from 14.5% to 8.5%. Water use will decline from 18 to 14.2 acre-inch/acre, nitrogen efficiency will rise from 54% to 68%, and emissions intensity will fall from 290 to 230 kg CO₂e/ton. Revenue per acre is projected to grow from ~$1,320 to ~$1,570, lifting program IRR from 8% to 18%. AI-powered analytics will enhance yield, efficiency, and sustainability, becoming the digital backbone of US farming.
What's Covered?
Report Summary
Key Takeaways
1. R² accuracy for yields climbs toward ~90% with richer telemetry and local calibration.
2. Variable‑rate irrigation and fertigation reduce water and nitrogen intensity.
3. Pest/disease early warning lowers forecast error and stabilizes outcomes.
4. Carbon and water MRV convert sustainability gains into monetizable credits.
5. Edge analytics on equipment reduces latency and improves prescription fidelity.
6. Data rights and consent frameworks increase grower trust and adoption.
7. Insurance and financing products begin to price in analytics‑verified risk cuts.
8. C‑suite dashboard: R² %, MAPE %, water/acre, NUE %, kg CO₂e/ton, $/acre, IRR.
a) Market Size & Share
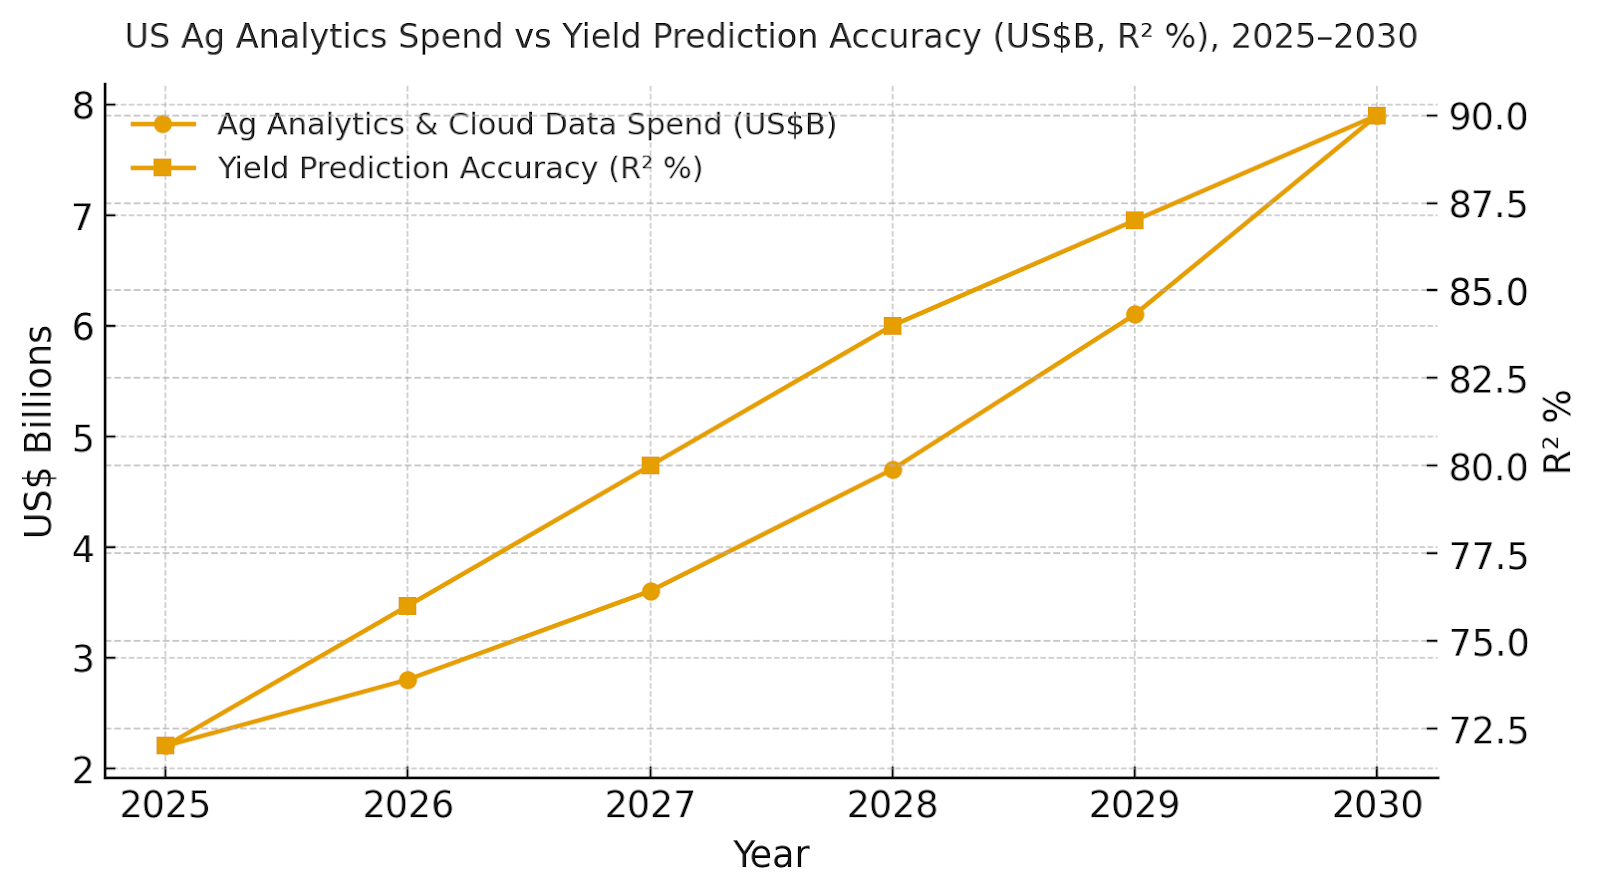
US ag analytics spend is modeled to grow from ~US$2.2B in 2025 to ~US$7.9B by 2030. The dual‑axis figure shows spend growth alongside yield prediction accuracy rising from ~72% to ~90% (R² %). Share accrues to vendors providing: (1) high‑refresh satellite and in‑field sensors; (2) explainable models tuned by micro‑region; and (3) integrations with farm equipment and FMS platforms. Risks: data sparsity for small parcels, cloud costs for high‑res imagery, and fragmented data rights. Mitigations: co‑op data exchanges, edge preprocessing, and standardized data contracts. Share should be tracked using R² %, MAPE %, water per acre, NUE %, kg CO₂e/ton, and revenue per acre—not revenue alone.
b) Market Analysis
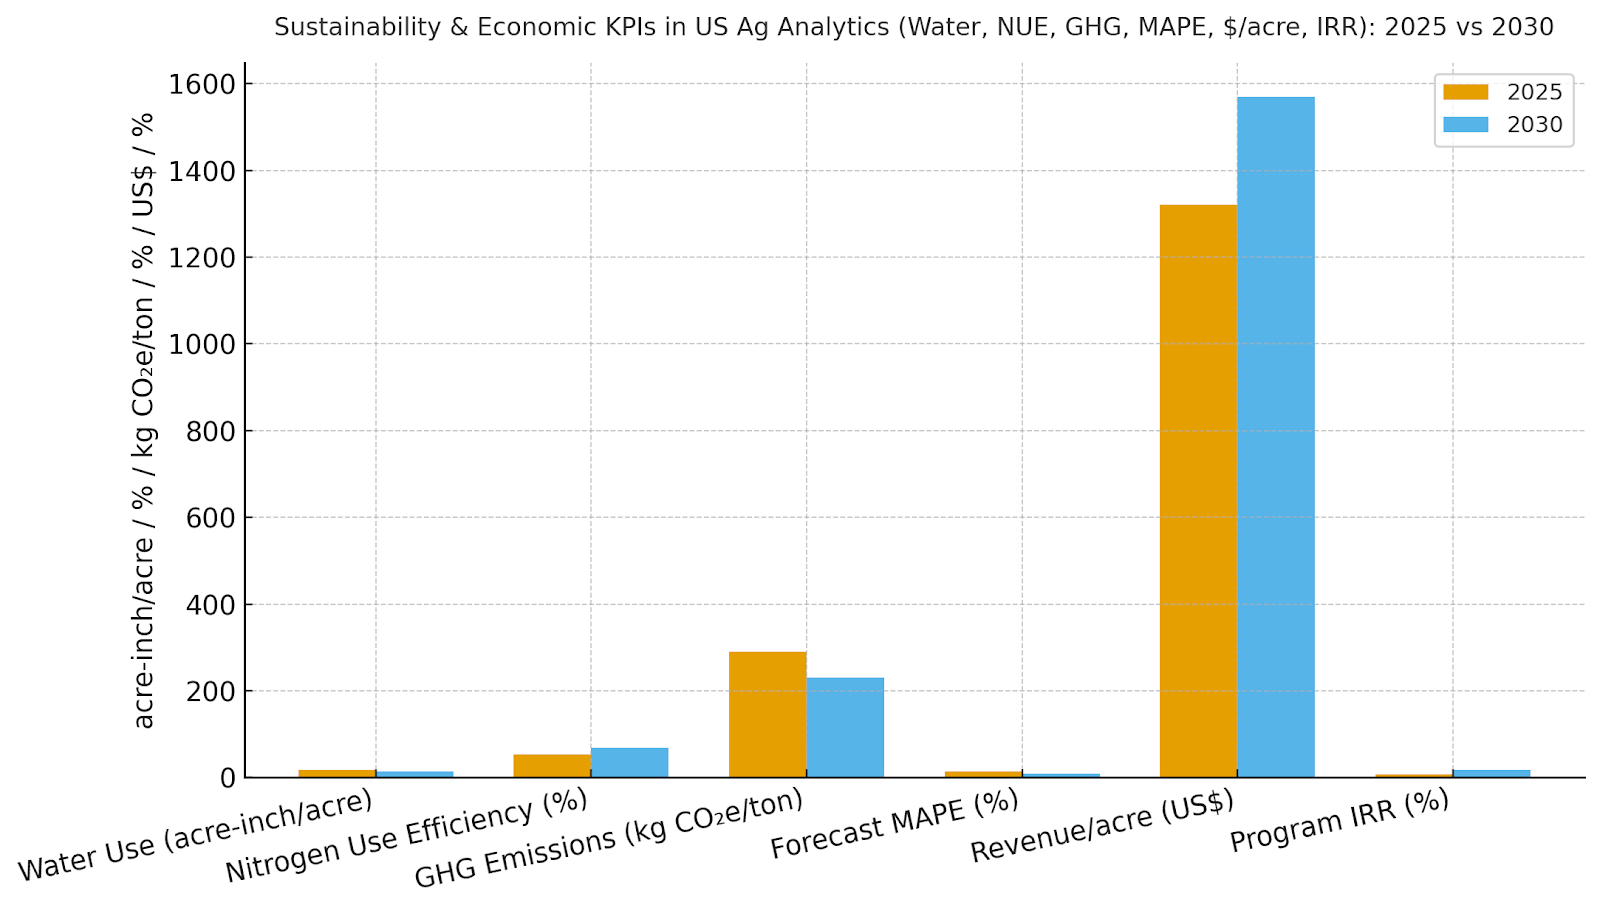
Our model shows forecast error (MAPE) dropping from ~14.5% to ~8.5% as data density and model calibration improve, while water use falls ~21% and NUE rises ~14 points due to precise prescriptions. Emissions intensity declines ~21% to ~230 kg CO₂e/ton; revenue per acre rises ~19% with better timing for planting, harvest, and marketing. IRR expands from ~8% to ~18% by 2030. Enablers: sensor and imagery fusion, RAG‑style agronomic knowledge retrieval, and on‑equipment edge analytics. Barriers: advisory capacity, connectivity in rural areas, and change management. Financial lens: combine input savings and yield stability with premiums/credits for verified sustainability. The bar figure summarizes KPI shifts for disciplined deployments.
c) Trends & Insights
1) Field‑level twins merge soil, canopy, and micro‑weather to guide prescriptions. 2) Edge analytics on machinery compresses latency and supports no‑signal zones. 3) Explainable AI for agronomy builds trust with growers and agronomists. 4) Carbon/water MRV integrates directly with offtake contracts and insurance. 5) Retailer platforms bundle agronomy advice with input financing. 6) Variable‑rate everything—seeding, irrigation, nutrition, crop protection—becomes standard. 7) AI‑assisted scouting (drone + hyperspectral) reduces disease/pest surprises. 8) Benchmarking shifts to revenue risk reduction and resilience metrics, not yields alone. 9) Privacy‑preserving data sharing enables co‑op analytics without exposing farm identities. 10) Government programs increasingly require telemetry‑backed reporting.
d) Segment Analysis
Row Crops (corn/soy/wheat): broad acreage supports sensor and satellite ROI; focus on irrigation and nitrogen prescriptions. Specialty Crops (fruits/veg/vineyards): higher margins justify dense sensing and disease models; micro‑climate analytics essential. Livestock‑adjacent crops (forage): focus on nutrition yield and harvest timing. Co‑ops/Aggregators: data exchanges, pooled advisory, and financing channels. Across segments, track R² %, MAPE %, water/acre, NUE %, kg CO₂e/ton, $ per acre, and IRR; calibrate models by micro‑region and management practices.
e) Geography Analysis
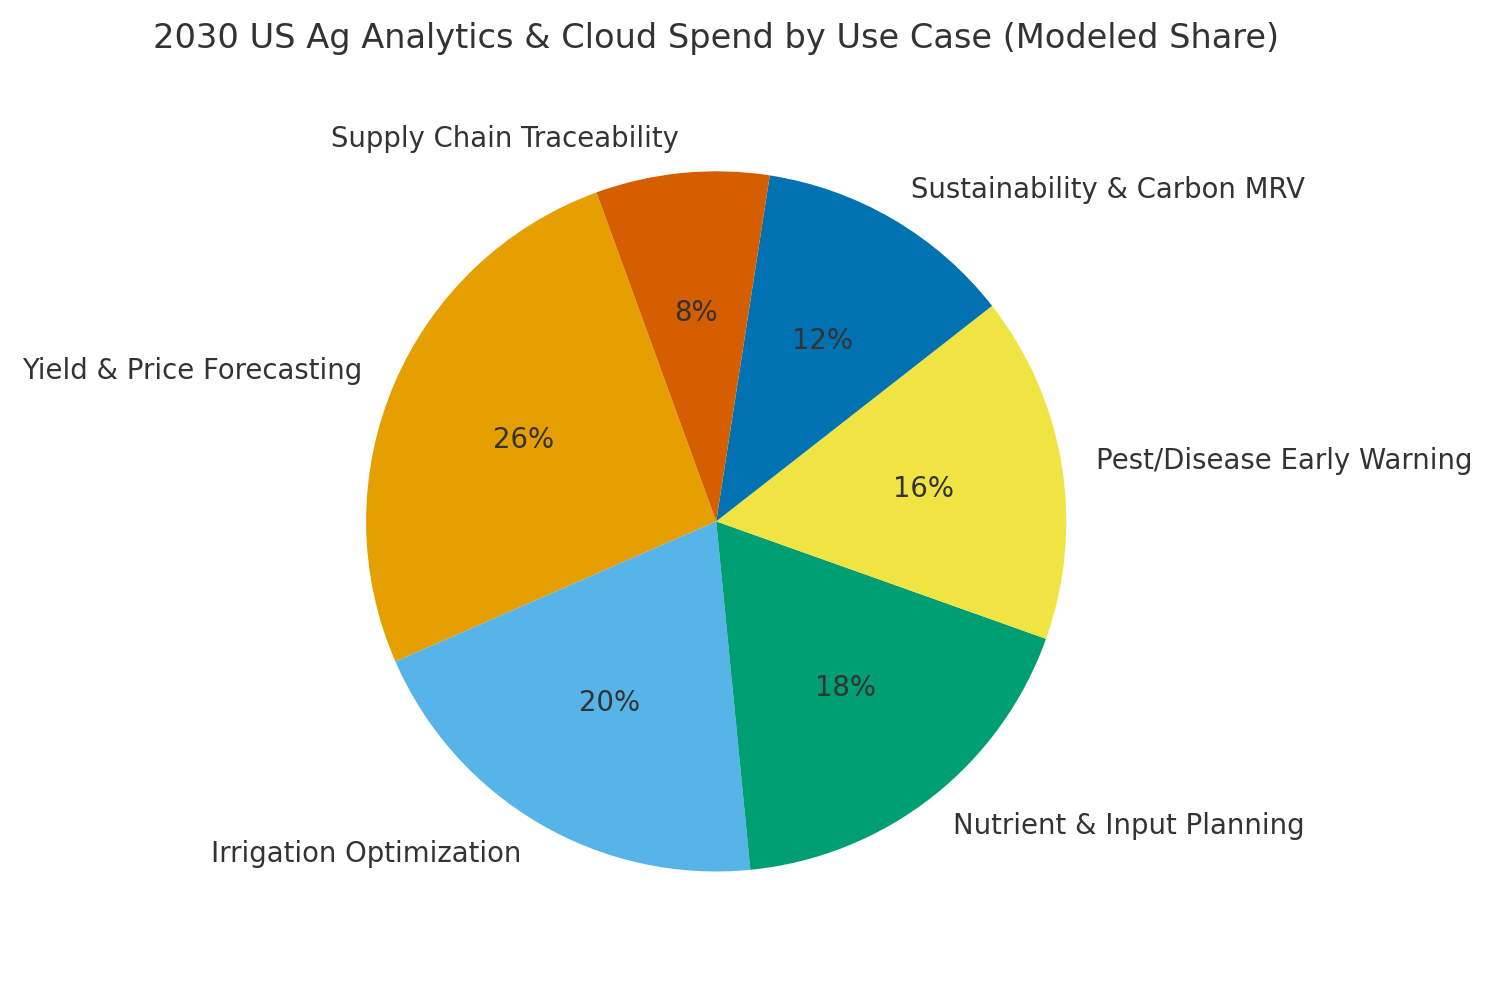
By 2030, we model US use‑case mix as Yield & Price (~26%), Irrigation (~20%), Nutrient Planning (~18%), Pest/Disease Early Warning (~16%), Sustainability & Carbon MRV (~12%), and Traceability (~8%). The pie figure reflects the mix. Adoption concentrates in the Corn Belt and irrigated West/Southwest; specialty crops in California and the Pacific Northwest drive dense sensing deployments. Execution: invest in local calibration datasets, ensure privacy‑preserving data contracts, and integrate with equipment OEM APIs.
f) Competitive Landscape
Competition spans satellite/remote sensing firms, farm management platforms, cloud hyperscalers, and input retailers with advisory networks. Differentiation vectors: (1) forecast accuracy and explainability, (2) prescription quality and compliance‑ready MRV outputs, (3) equipment/FMS integrations and edge capabilities, (4) privacy and data rights frameworks, and (5) time‑to‑value with templates per crop/region. Procurement guidance: require open APIs, exportable models/recommendations, field‑level MRV, and ROI audits. Competitive KPIs: R² %, MAPE %, water/acre, NUE %, kg CO₂e/ton, $/acre, and IRR uplift.
Report Details
Proceed To Buy
Want a More Customized Experience?
- Request a Customized Transcript: Submit your own questions or specify changes. We’ll conduct a new call with the industry expert, covering both the original and your additional questions. You’ll receive an updated report for a small fee over the standard price.
- Request a Direct Call with the Expert: If you prefer a live conversation, we can facilitate a call between you and the expert. After the call, you’ll get the full recording, a verbatim transcript, and continued platform access to query the content and more.
68 Circular Road, #02-01 049422, Singapore
Revenue Tower, Scbd, Jakarta 12190, Indonesia
4th Floor, Pinnacle Business Park, Andheri East, Mumbai, 400093
Cinnabar Hills, Embassy Golf Links Business Park, Bengaluru, Karnataka 560071
Request Custom Transcript
Related Transcripts


$ 1350

68 Circular Road, #02-01 049422, Singapore
Revenue Tower, Scbd, No.52-53, Jakarta 12190, Indonesia
Cinnabar Hills, Embassy Golf Links Business Park, Bengaluru, Karnataka 560071
4th Floor, Pinnacle Business Park, Andheri East, Mumbai, 400093


68 Circular Road, #02-01 049422, Singapore
Revenue Tower, Scbd, Jakarta 12190, Indonesia
4th Floor, Pinnacle Business Park, Andheri East, Mumbai, 400093
Cinnabar Hills, Embassy Golf Links Business Park, Bengaluru, Karnataka 560071