

68 Circular Road, #02-01 049422, Singapore
Revenue Tower, Scbd, Jakarta 12190, Indonesia
4th Floor, Pinnacle Business Park, Andheri East, Mumbai, 400093
Cinnabar Hills, Embassy Golf Links Business Park, Bengaluru, Karnataka 560071


Connect With Us


68 Circular Road, #02-01 049422, Singapore
Revenue Tower, Scbd, Jakarta 12190, Indonesia
4th Floor, Pinnacle Business Park, Andheri East, Mumbai, 400093
Cinnabar Hills, Embassy Golf Links Business Park, Bengaluru, Karnataka 560071
Connect With Us
68 Circular Road, #02-01 049422, Singapore
Revenue Tower, Scbd, Jakarta 12190, Indonesia
4th Floor, Pinnacle Business Park, Andheri East, Mumbai, 400093
Cinnabar Hills, Embassy Golf Links Business Park, Bengaluru, Karnataka 560071
Request Custom Transcript
AI-Optimized Content Delivery Networks: Latency Reduction & Global Market Penetration
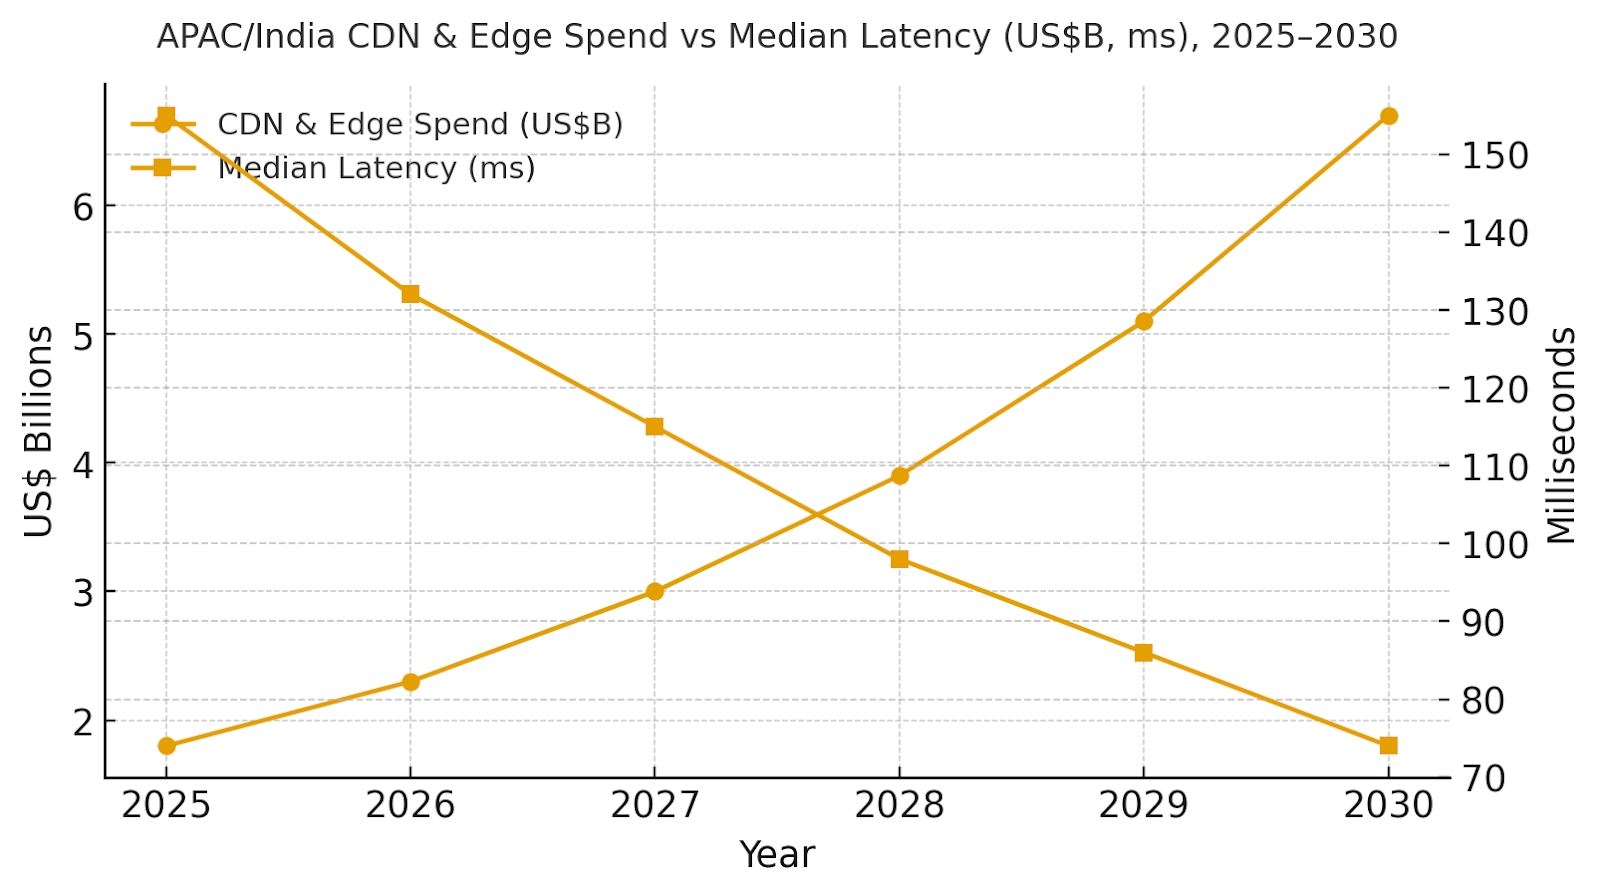
India and the wider Asia-Pacific region are adopting AI-optimized CDNs that learn traffic patterns, congestion, and device performance to cut latency and improve delivery efficiency. CDN and edge compute spend is projected to grow from ~$1.8B in 2025 to ~$6.7B by 2030. Median latency will drop from 155ms to 74ms, cache hit rates will rise from 72% to 89%, and delivery costs per GB will fall from $0.050 to $0.027. Program IRR is expected to improve from 9% to 19%. The architecture uses multi-CDN orchestration, edge functions, and AI-driven routing. Risks like model drift and peering limits are mitigated with ISP-specific policies and fallback rules. AI-powered CDNs will enhance performance, stability, and user experience across India and APAC.
What's Covered?
Report Summary
Key Takeaways
1. AI routing reduces p50/p95 latency materially across congested peering points.
2. Edge functions enable dynamic acceleration and origin offload without app rewrites.
3. Origin‑shield and pre‑positioning lift cache hit rate to ~89% by 2030.
4. Security (WAF/DDoS/bot) converges with traffic policy for unified control.
5. Multi‑CDN with AI policy mitigates vendor/regional performance variance.
6. Unit cost per GB declines ~46% as offload improves and compression adapts.
7. Rebuffering drops to ~1.1% improving watch time and ads viewability.
8. C‑suite dashboard: p50/p95 ms, hit %, offload %, $/GB, rebuffer %, IRR.

a) Market Size & Share
APAC/India CDN & edge spend is modeled to grow from ~US$1.8B to ~US$6.7B (2025–2030) as platforms blend traditional caching with AI traffic policy and edge compute. The dual‑axis figure shows spend growth versus a drop in median latency from ~155ms to ~74ms. Share accrues to vendors with (1) multi‑CDN control planes, (2) ISP/metro‑aware policies, and (3) integrated security. Execution risks: inconsistent last‑mile quality and uneven peering; mitigations: per‑ISP probes, regional origin‑shield tiers, and active‑active origins. Share should be tracked via p50/p95 latency, cache hit %, origin offload %, $/GB, rebuffering %, and IRR.
b) Market Analysis
Our model shows p50 latency improving ~52% and p95 ~53% as AI routing selects lower‑congestion paths and co‑locates content near demand. Cache hit rises to ~89% with origin‑shield and predictive pre‑positioning; origin offload reaches ~78%, cutting origin egress and compute. Delivery cost per GB declines from ~$0.050 to ~$0.027, and streaming rebuffering falls from ~2.9% to ~1.1% as bitrate adaptation stabilizes. These gains support IRR growth from ~9% to ~19% by 2030. Enablers: multi‑CDN orchestration, edge functions, content‑aware compression, and unified WAF/DDoS/bot policy. Barriers: seasonal spikes, ISP outages, and cache thrash from poor TTLs.
Financial lens: combine hard network savings with revenue lift from conversion and engagement. The bar figure summarizes KPI shifts expected from disciplined programs.

c) Trends & Insights
1) AI traffic policy layers over multi‑CDN, selecting ISPs/routes by real‑time congestion and device class. 2) Edge functions personalize content and compress adaptively. 3) Origin‑shield tiers learn freshness and popularity to minimize thundering‑herd misses. 4) Unified WAF/DDoS/bot protection merges with routing policy for one control plane. 5) Privacy‑preserving RUM and synthetic probes feed models without storing PII. 6) Gaming/streaming add QUIC/HTTP3 tuning for jitter sensitivity. 7) Enterprise CDN grows through private caches and API acceleration. 8) Green delivery emerges—carbon‑aware routing and peering optimize energy per GB. 9) SLA evolution includes p95 targets, probabilistic guarantees, and penalties tied to business KPIs. 10) Procurement favors open APIs and exportable policies to avoid lock‑in.
d) Segment Analysis
E‑commerce: conversion‑driven p50/p95 goals and image/video optimization; surge‑proof pre‑positioning. Streaming: rebuffering and bitrate stability; ISP‑aware routing. Gaming: packet loss/jitter prioritization, UDP/QUIC tuning, and edge matchmaking. Fintech: API acceleration with strict WAF/bot policies and fraud shields. SaaS/Enterprise: private caches and API edge for collaboration/perf telemetry. Public Services: language localization and accessibility with predictable spend. Track per‑segment KPIs: p50/p95 ms, hit %, offload %, $/GB, rebuffer %, and IRR; tune policy sets and TTLs quarterly.
e) Geography Analysis
By 2030, we model APAC/India spend distribution by use case as AI Routing & Congestion (~24%), Edge Compute (~20%), Streaming & Gaming (~20%), Security (WAF/DDoS/Bot) (~18%), Last‑Mile Acceleration & P2P (~10%), and Enterprise CDN & Private Caches (~8%). The pie figure reflects the mix. India’s tier‑1 metros (Delhi NCR, Mumbai, Bengaluru, Hyderabad, Chennai) drive early adoption; tier‑2/3 expansion follows via ISP partnerships and city‑edge PoPs. Execution: deploy per‑ISP probes, tune TTLs by vertical, and maintain active‑active origins for surge resilience.

f) Competitive Landscape
Competition spans global CDNs, regional carriers, and edge‑compute platforms. Differentiation vectors: (1) p95 latency and rebuffering in India metros across major ISPs, (2) cache hit/offload and $/GB trajectory, (3) edge functions latency and cold‑start behavior, (4) unified WAF/DDoS/bot accuracy with low FP rates, and (5) openness of routing policy and data exports. Procurement guidance: require per‑ISP SLA breakouts, synthetic + RUM telemetry access, and exportable policies. Competitive KPIs: p50/p95 ms, hit %, offload %, $/GB, rebuffer %, and IRR uplift.
Report Details
Proceed To Buy
Want a More Customized Experience?
- Request a Customized Transcript: Submit your own questions or specify changes. We’ll conduct a new call with the industry expert, covering both the original and your additional questions. You’ll receive an updated report for a small fee over the standard price.
- Request a Direct Call with the Expert: If you prefer a live conversation, we can facilitate a call between you and the expert. After the call, you’ll get the full recording, a verbatim transcript, and continued platform access to query the content and more.
68 Circular Road, #02-01 049422, Singapore
Revenue Tower, Scbd, Jakarta 12190, Indonesia
4th Floor, Pinnacle Business Park, Andheri East, Mumbai, 400093
Cinnabar Hills, Embassy Golf Links Business Park, Bengaluru, Karnataka 560071
Request Custom Transcript
Related Transcripts


68 Circular Road, #02-01 049422, Singapore
Revenue Tower, Scbd, No.52-53, Jakarta 12190, Indonesia
Cinnabar Hills, Embassy Golf Links Business Park, Bengaluru, Karnataka 560071
4th Floor, Pinnacle Business Park, Andheri East, Mumbai, 400093


68 Circular Road, #02-01 049422, Singapore
Revenue Tower, Scbd, Jakarta 12190, Indonesia
4th Floor, Pinnacle Business Park, Andheri East, Mumbai, 400093
Cinnabar Hills, Embassy Golf Links Business Park, Bengaluru, Karnataka 560071