

68 Circular Road, #02-01 049422, Singapore
Revenue Tower, Scbd, Jakarta 12190, Indonesia
4th Floor, Pinnacle Business Park, Andheri East, Mumbai, 400093
Cinnabar Hills, Embassy Golf Links Business Park, Bengaluru, Karnataka 560071


Connect With Us


68 Circular Road, #02-01 049422, Singapore
Revenue Tower, Scbd, Jakarta 12190, Indonesia
4th Floor, Pinnacle Business Park, Andheri East, Mumbai, 400093
Cinnabar Hills, Embassy Golf Links Business Park, Bengaluru, Karnataka 560071
Connect With Us
68 Circular Road, #02-01 049422, Singapore
Revenue Tower, Scbd, Jakarta 12190, Indonesia
4th Floor, Pinnacle Business Park, Andheri East, Mumbai, 400093
Cinnabar Hills, Embassy Golf Links Business Park, Bengaluru, Karnataka 560071
Request Custom Transcript
AI-Driven Digital Shelf Optimization: Content Personalization & Omnichannel Visibility Strategies
From 2025 to 2030, the digital shelf evolves from static PDPs to dynamic, AI‑orchestrated experiences that personalize content, badges, and offers in near real time across retail sites, apps, and marketplaces. Models synthesize behavioral signals (search queries, scroll depth, add‑to‑cart), natural‑language sentiment from reviews/social, and competitive cues (rank, availability, price, badges) to assemble the right title, imagery, bullets, and recommendation widgets by audience and context. The operating model shifts from quarterly content refreshes to continuous experimentation with governance—versioned copy, approval workflows, and explainable interventions tied to KPIs.
What's Covered?
Report Summary
Key Takeaways
1. Conversion gains compound when content, rank, availability, and media spend are optimized jointly.
2. Aspect‑level sentiment and Q&A mining surface what to fix in titles, bullets, and imagery fast.
3. Modular assets + automated QA slash publish latency from hours to minutes across channels.
4. Retailer API depth and feed cadence determine how real‑time your ‘real‑time’ can be.
5. Governance matters: brand voice guardrails, approvals, and audit trails avoid AI‑induced drift.
6. Omnichannel attribute parity reduces returns and confusion; align store kiosks with online PDPs.
7. Competitive value scores (rank + availability + reviews) beat price‑only benchmarks.
8. Telemetry for attribution unlocks finance sign‑off and media reallocation without guesswork.
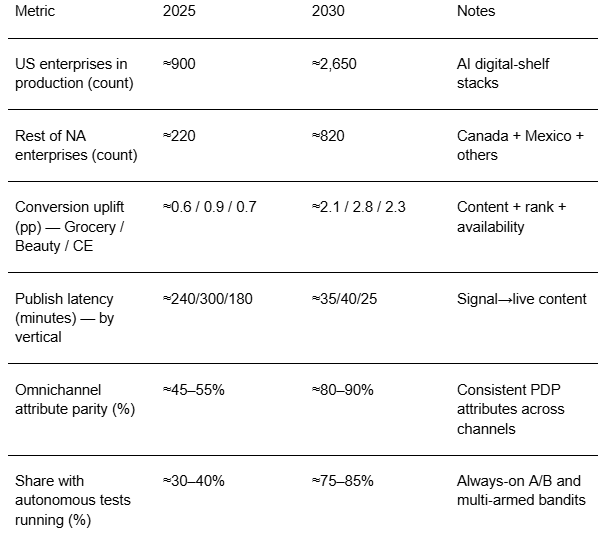
Key Metrics
Market Size & Share
Adoption concentrates where product catalogs are dynamic and retail media is material to growth. In this illustrative outlook, US production adopters expand from ~900 in 2025 to ~2,650 by 2030, while the rest of North America scales from ~220 to ~820. Early share accrues to grocery/mass and beauty due to high SKU churn and promotion cadence; consumer electronics adopts steadily as MAP policies and technical content needs catch up with personalization tooling. Market share consolidates around platforms that integrate content decisioning, rank optimization, and availability monitoring with direct publishing to major retailers.
Winning share requires three ingredients: (i) unified product graph with variant logic and channel attributes; (ii) fast publish paths through retailer APIs/feeds and QA monitors; and (iii) attribution that ties conversion, rank, and returns to specific content changes. By 2030, a handful of vendors and mature in‑house stacks anchor omnichannel PDP parity across web, app, marketplace, and store kiosks.

Market Analysis
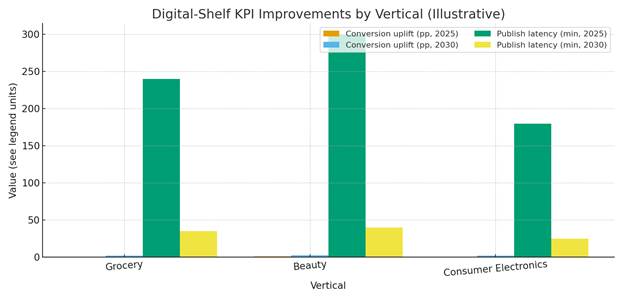
Conversion uplift derives from faster iteration on titles, bullets, imagery, and badges that match shopper intent. In this outlook, verticals move from ~0.6–0.9 pp conversion lift in 2025 pilots to ~2.1–2.8 pp by 2030, while publish latency collapses from ~180–300 minutes to ~25–40. Gains are largest when content optimization is coordinated with retail media spend and inventory visibility; rank improvements then compound organic clicks. Cost drivers include data licensing (reviews, search queries, competitor rank), integration to retailer APIs, and human governance time (brand/legal). Benefits: higher conversion, fewer returns via attribute parity, and better value perception through complete PDPs.
Risks: hallucinated or non‑compliant copy, inconsistent images, broken variant links, and bias in sentiment classification. Mitigations: brand voice templates, claim substantiation checks, accessibility tests, image QA, schema validation, and rollback plans. Program performance should be governed by clear SLAs—publish latency, image completeness, attribute parity—and tied to finance‑grade attribution.
Trends & Insights (2025–2030)
• Aspect‑level sentiment and Q&A mining drive targeted copy and media updates within hours.
• Generative image variants (angles, context) expand media completeness while respecting brand templates.
• Retail media and organic rank converge into a unified ‘share of shelf’ objective function.
• Edge content updates for store kiosks and associate devices bring parity to physical channels.
• Privacy‑preserving learning reduces movement of user data; audit trails document interventions.
• Accessibility and compliance gates (ADA, claims) become default pre‑publish checks.
• Vendor ecosystems consolidate; APIs for direct PDP edits and rank feedback standardize.
• Finance teams demand causal attribution before re‑allocating media and content budgets.
Segment Analysis
• Grocery/Mass: constant churn; automate copy and image refreshes, ensure availability/price parity, and align promos to store supply.
• Beauty/Personal Care: sentiment on fragrance/texture drives micro‑copy; image hygiene (shade finders) critical to reduce returns.
• Consumer Electronics: technical specs and compatibility; MAP and bundles; Q&A mining plugs gaps; track returns reasons.
• Home/DIY: seasonal trends and how‑to content; localized compatibility guides; heavy emphasis on imagery.
• Apparel/Footwear: fit/size sentiment, model diversity, and variant mapping; omnichannel size availability.
Buyer guidance: clean product graph; enforce guardrails; prioritize channels with the deepest APIs; and stage rollout with A/B tests and finance‑grade attribution.
Geography Analysis (North America)
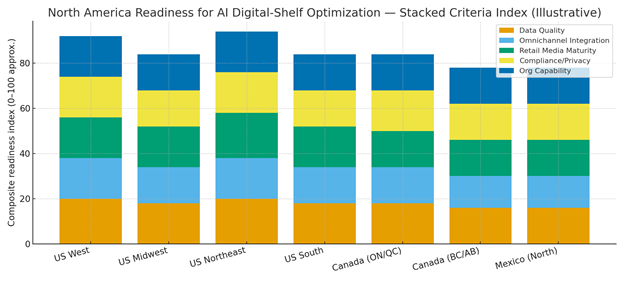
Readiness clusters in the US Northeast and West given data talent and retail‑tech vendors; the South and Midwest advance as omnichannel data quality improves. Ontario/Quebec benefit from data governance capabilities; Western Canada and Northern Mexico grow as marketplaces and cross‑border retail scale. The stacked criteria—data quality, omnichannel integration, retail media maturity, compliance/privacy, and organization capability—indicate where closed‑loop digital‑shelf operations can scale first.
Implications: start in regions with strong retailer API access and engineering talent; build product‑graph MDM; negotiate review/search/competitive rank data feeds; and codify omnichannel parity rules to stabilize customer experience across touchpoints.
Competitive Landscape (Platforms & Operating Models)
Stacks converge on: (i) content decisioning engines with templates/guardrails; (ii) review/social sentiment pipelines; (iii) retail media + organic rank integration; (iv) direct publish to retailer APIs; and (v) attribution dashboards. Differentiators: latency SLAs, aspect‑level sentiment quality, API depth across retailers, and governance tooling. System integrators package managed services for mid‑market brands; enterprise players build in‑house cores augmented by vendor data and publish adapters. Outcome‑based pricing tied to verified conversion uplift and latency SLAs gains traction. Winners show repeatable playbooks, auditability, and omnichannel parity, turning digital‑shelf optimization into a finance‑approved growth lever by 2030.
Report Details
Proceed To Buy
Want a More Customized Experience?
- Request a Customized Transcript: Submit your own questions or specify changes. We’ll conduct a new call with the industry expert, covering both the original and your additional questions. You’ll receive an updated report for a small fee over the standard price.
- Request a Direct Call with the Expert: If you prefer a live conversation, we can facilitate a call between you and the expert. After the call, you’ll get the full recording, a verbatim transcript, and continued platform access to query the content and more.
68 Circular Road, #02-01 049422, Singapore
Revenue Tower, Scbd, Jakarta 12190, Indonesia
4th Floor, Pinnacle Business Park, Andheri East, Mumbai, 400093
Cinnabar Hills, Embassy Golf Links Business Park, Bengaluru, Karnataka 560071
Request Custom Transcript
Related Transcripts


68 Circular Road, #02-01 049422, Singapore
Revenue Tower, Scbd, No.52-53, Jakarta 12190, Indonesia
Cinnabar Hills, Embassy Golf Links Business Park, Bengaluru, Karnataka 560071
4th Floor, Pinnacle Business Park, Andheri East, Mumbai, 400093


68 Circular Road, #02-01 049422, Singapore
Revenue Tower, Scbd, Jakarta 12190, Indonesia
4th Floor, Pinnacle Business Park, Andheri East, Mumbai, 400093
Cinnabar Hills, Embassy Golf Links Business Park, Bengaluru, Karnataka 560071