

68 Circular Road, #02-01 049422, Singapore
Revenue Tower, Scbd, Jakarta 12190, Indonesia
4th Floor, Pinnacle Business Park, Andheri East, Mumbai, 400093
Cinnabar Hills, Embassy Golf Links Business Park, Bengaluru, Karnataka 560071


Connect With Us


68 Circular Road, #02-01 049422, Singapore
Revenue Tower, Scbd, Jakarta 12190, Indonesia
4th Floor, Pinnacle Business Park, Andheri East, Mumbai, 400093
Cinnabar Hills, Embassy Golf Links Business Park, Bengaluru, Karnataka 560071
Connect With Us
68 Circular Road, #02-01 049422, Singapore
Revenue Tower, Scbd, Jakarta 12190, Indonesia
4th Floor, Pinnacle Business Park, Andheri East, Mumbai, 400093
Cinnabar Hills, Embassy Golf Links Business Park, Bengaluru, Karnataka 560071
Request Custom Transcript
AI-Driven Cybersecurity Threat Detection: Market Adoption & Regulatory Compliance
US enterprises are accelerating AI-driven threat detection across endpoints, identities, cloud workloads, and OT/IoT, moving from traditional SIEM/SOC models to advanced analytics using behavior, graph, and language models. Spend on these solutions is expected to grow from ~$6.8B in 2025 to ~$18.9B by 2030. Key improvements include reduced Mean Time to Detect (MTTD) from 28 to 6 hours, and Mean Time to Respond (MTTR) from 19 to 4 hours, with false-positive rates dropping from 18% to 7%. The architecture includes unified telemetry, ML anomaly detection, and SOAR automation, with regulatory compliance for healthcare, finance, and critical infrastructure. AI-driven detection will enhance resilience, reduce breach probability, and satisfy auditors with continuous monitoring.
What's Covered?
Report Summary
Key Takeaways
1. Graph + behavior analytics reduce MTTD/MTTR by automating context and actions.
2. Context-aware models cut false positives and alert fatigue substantially.
3. Agentless discovery and identity telemetry expand coverage to ~90% of assets.
4. SOC copilots accelerate triage; guard with least-privilege and red-team tests.
5. Cloud + identity attack paths dominate; XDR and ITDR converge in roadmaps.
6. Regulators push continuous monitoring and timely incident disclosure.
7. CFO view: avoided breach losses + lower response labor lift IRR to ~20%.
8. Board dashboard: MTTD, MTTR, FP %, coverage %, incidents/10k, high-sev dwell time.
a) Market Size & Share
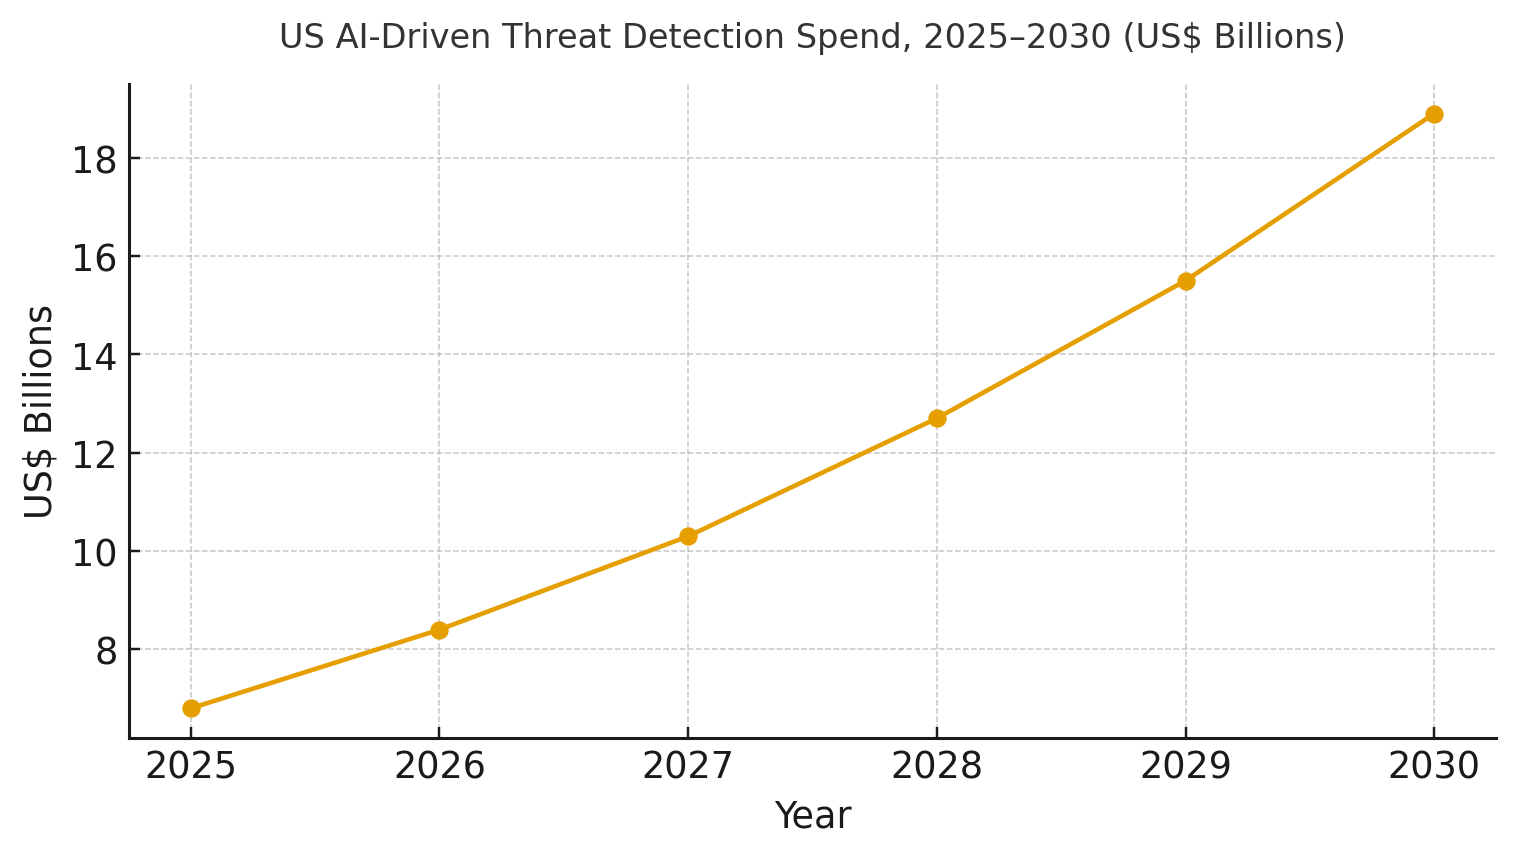
US spend on AI‑driven threat detection platforms is modeled to grow from ~US$6.8B in 2025 to ~US$18.9B by 2030 as organizations converge EDR/XDR, ITDR, cloud workload security, and SOAR automation. The line figure shows the trajectory. Share accrues to vendors offering unified telemetry, graph enrichment, and explainable analytics with strong response automation. Execution risks: fragmented inventories, shadow SaaS, and skill gaps; mitigations: asset graphs, coverage SLAs, and co‑managed SOC. Track share via MTTD/MTTR, false‑positive %, coverage %, incidents/10k, triage time, and IRR uplift.
b) Market Analysis
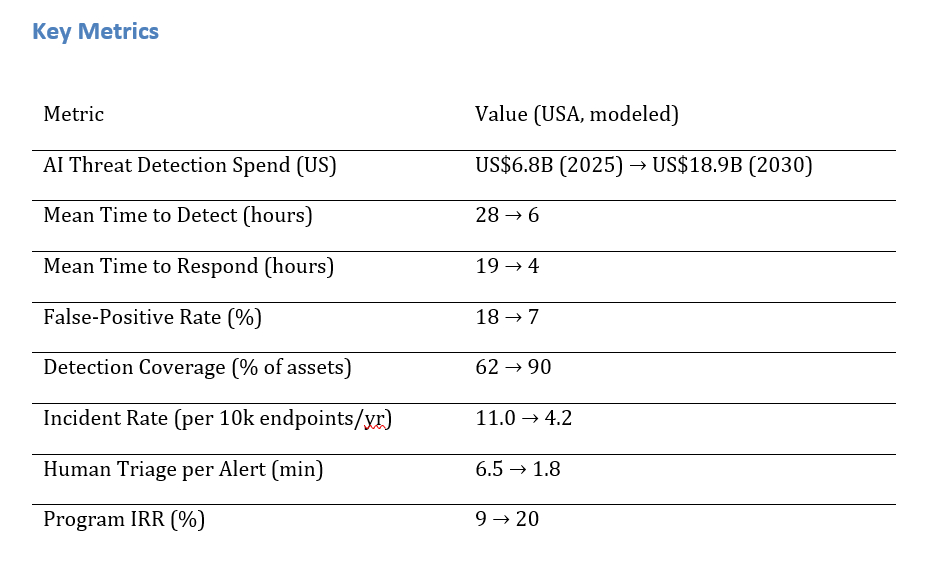
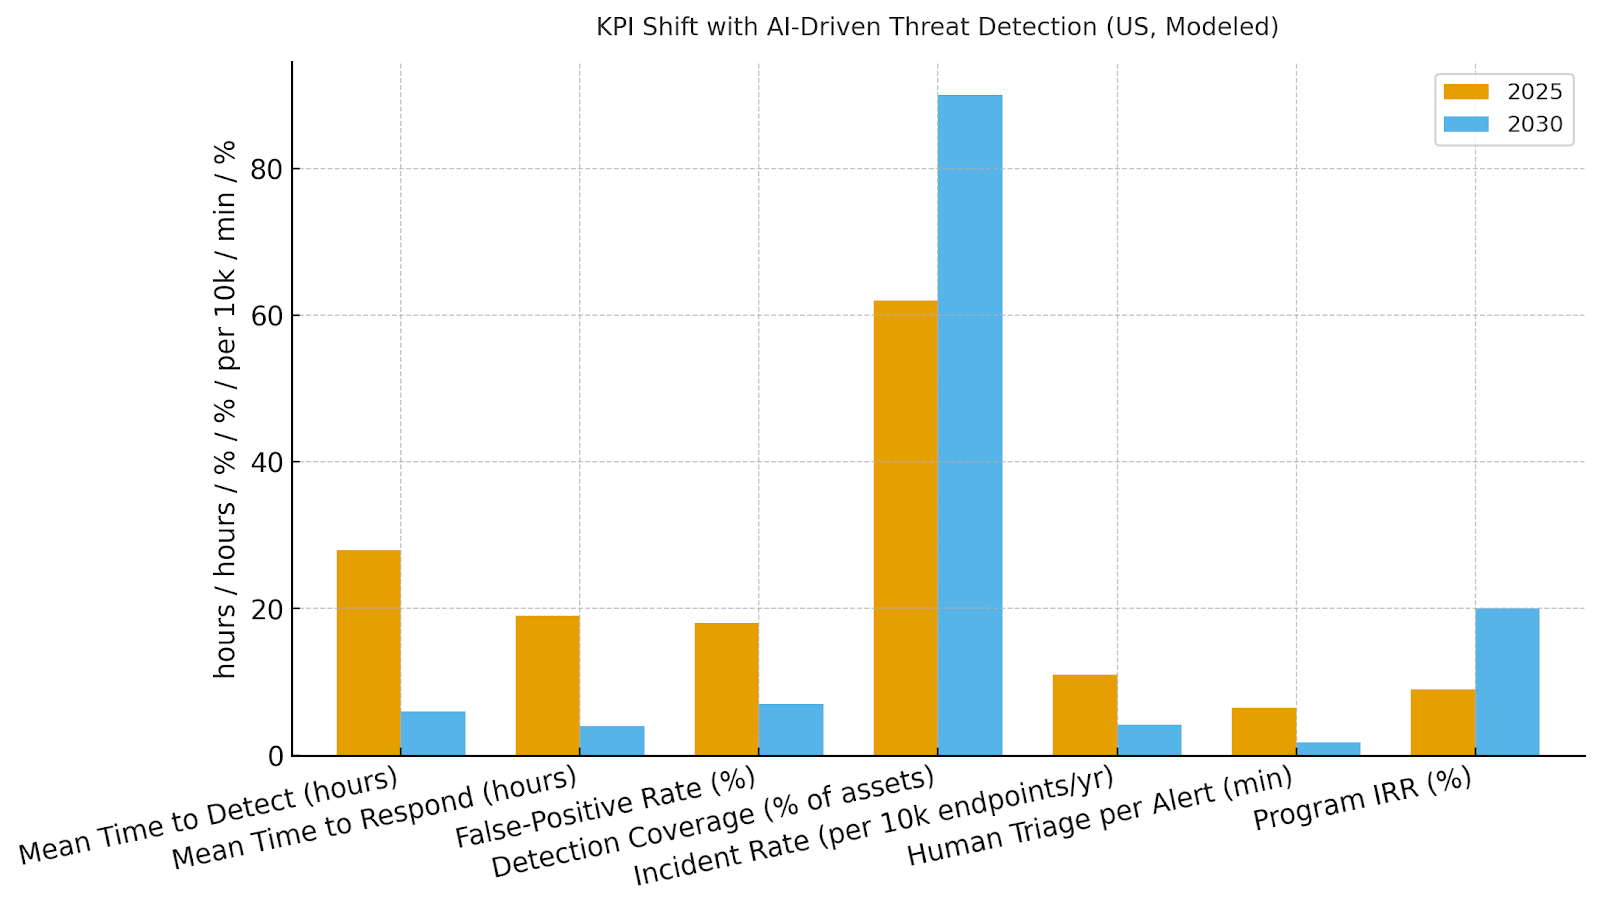
Quantified improvements drive adoption: MTTD improves 28→6 hrs, MTTR 19→4 hrs, false positives 18→7%, coverage 62→90%, incidents 11.0→4.2 per 10k endpoints, and human triage 6.5→1.8 minutes—supporting IRR growth from ~9→~20% by 2030. Enablers: identity‑aware analytics, graph correlation, and SOAR playbooks with guardrails. Barriers: alert fatigue, model drift, and integration overhead with legacy SIEM.
Financial lens: avoided breach loss (probability × impact), reduced labor, and downtime avoidance vs subscription/ops cost. The bar chart summarizes KPI movement under disciplined programs.
c) Trends & Insights
1) Identity‑centric detections (ITDR) rise as credential abuse dominates. 2) LLM SOC copilots triage narratives but require strict isolation and guardrails. 3) Graph correlation fuses endpoint, identity, and cloud signals to reduce false positives. 4) Autonomous containment expands for low‑risk playbooks. 5) ASM and threat intel feed risk scoring for prioritization. 6) Privacy‑preserving analytics (tokenization, differential privacy) support evidence needs. 7) Data pipeline hardening prevents tampering with training or inference. 8) KPIs standardize under NIST CSF 2.0 and board reporting templates. 9) Managed detection partnerships fill skill gaps. 10) Green SOC practices optimize storage/compute of logs without losing fidelity.
d) Segment Analysis
Financial Services: rapid response and regulatory evidence; heavy identity analytics. Healthcare: HIPAA evidence, PHI protection, and device/IoT telemetry. Technology/SaaS: cloud‑first detections and SOAR automation; focus on triage time. Retail: POS/edge monitoring and fraud signal fusion. Manufacturing/OT: anomaly detection on industrial protocols and segmentation. Public Sector: FedRAMP‑aligned logging and incident timelines. Across segments, define playbooks for isolation, reset, and revoke; track MTTD, MTTR, FP %, coverage %, incidents/10k, and triage minutes.
e) Geography Analysis
By 2030, we model US spend/use‑case mix as EDR/XDR & SOC Automation (~28%), Cloud Workload & Container Security (~22%), Email & Collaboration (~16%), Identity Threat Detection & Response (~16%), OT/IoT Anomaly Detection (~10%), and Threat Intelligence/ASM (~8%). Large metro enterprises lead cloud and identity investments, while OT/IoT growth concentrates in manufacturing hubs. The pie figure reflects the mix.
Execution: unify asset/identity graphs, enforce coverage SLAs, and phase automation with human approvals. Measure region‑specific MTTD/MTTR, FP %, coverage %, incidents/10k, triage minutes, and IRR; rebalance spend quarterly.

f) Competitive Landscape
Vendors span XDR suites, cloud security platforms, identity analytics, SOAR, and ASM/intel providers. Differentiation vectors: (1) identity‑aware detections and graph correlation, (2) low false‑positive rates with explainability, (3) safe automation with rollback on playbooks, (4) evidence and chain‑of‑custody for audits, and (5) time‑to‑value via prebuilt integrations. Procurement guidance: require open APIs, tenant isolation, privacy controls, model‑drift monitoring, and KPIs that tie directly to MTTD/MTTR and breach loss. Competitive KPIs: MTTD, MTTR, FP %, coverage %, incidents/10k, triage minutes, IRR.
Report Details
Proceed To Buy
Want a More Customized Experience?
- Request a Customized Transcript: Submit your own questions or specify changes. We’ll conduct a new call with the industry expert, covering both the original and your additional questions. You’ll receive an updated report for a small fee over the standard price.
- Request a Direct Call with the Expert: If you prefer a live conversation, we can facilitate a call between you and the expert. After the call, you’ll get the full recording, a verbatim transcript, and continued platform access to query the content and more.
68 Circular Road, #02-01 049422, Singapore
Revenue Tower, Scbd, Jakarta 12190, Indonesia
4th Floor, Pinnacle Business Park, Andheri East, Mumbai, 400093
Cinnabar Hills, Embassy Golf Links Business Park, Bengaluru, Karnataka 560071
Request Custom Transcript
Related Transcripts
$ 1350

68 Circular Road, #02-01 049422, Singapore
Revenue Tower, Scbd, No.52-53, Jakarta 12190, Indonesia
Cinnabar Hills, Embassy Golf Links Business Park, Bengaluru, Karnataka 560071
4th Floor, Pinnacle Business Park, Andheri East, Mumbai, 400093


68 Circular Road, #02-01 049422, Singapore
Revenue Tower, Scbd, Jakarta 12190, Indonesia
4th Floor, Pinnacle Business Park, Andheri East, Mumbai, 400093
Cinnabar Hills, Embassy Golf Links Business Park, Bengaluru, Karnataka 560071