

68 Circular Road, #02-01 049422, Singapore
Revenue Tower, Scbd, Jakarta 12190, Indonesia
4th Floor, Pinnacle Business Park, Andheri East, Mumbai, 400093
Cinnabar Hills, Embassy Golf Links Business Park, Bengaluru, Karnataka 560071


Connect With Us


68 Circular Road, #02-01 049422, Singapore
Revenue Tower, Scbd, Jakarta 12190, Indonesia
4th Floor, Pinnacle Business Park, Andheri East, Mumbai, 400093
Cinnabar Hills, Embassy Golf Links Business Park, Bengaluru, Karnataka 560071
Connect With Us
68 Circular Road, #02-01 049422, Singapore
Revenue Tower, Scbd, Jakarta 12190, Indonesia
4th Floor, Pinnacle Business Park, Andheri East, Mumbai, 400093
Cinnabar Hills, Embassy Golf Links Business Park, Bengaluru, Karnataka 560071
Request Custom Transcript
AI-Driven Cloud Resource Allocation: Predictive Scaling & Cost Optimization Models
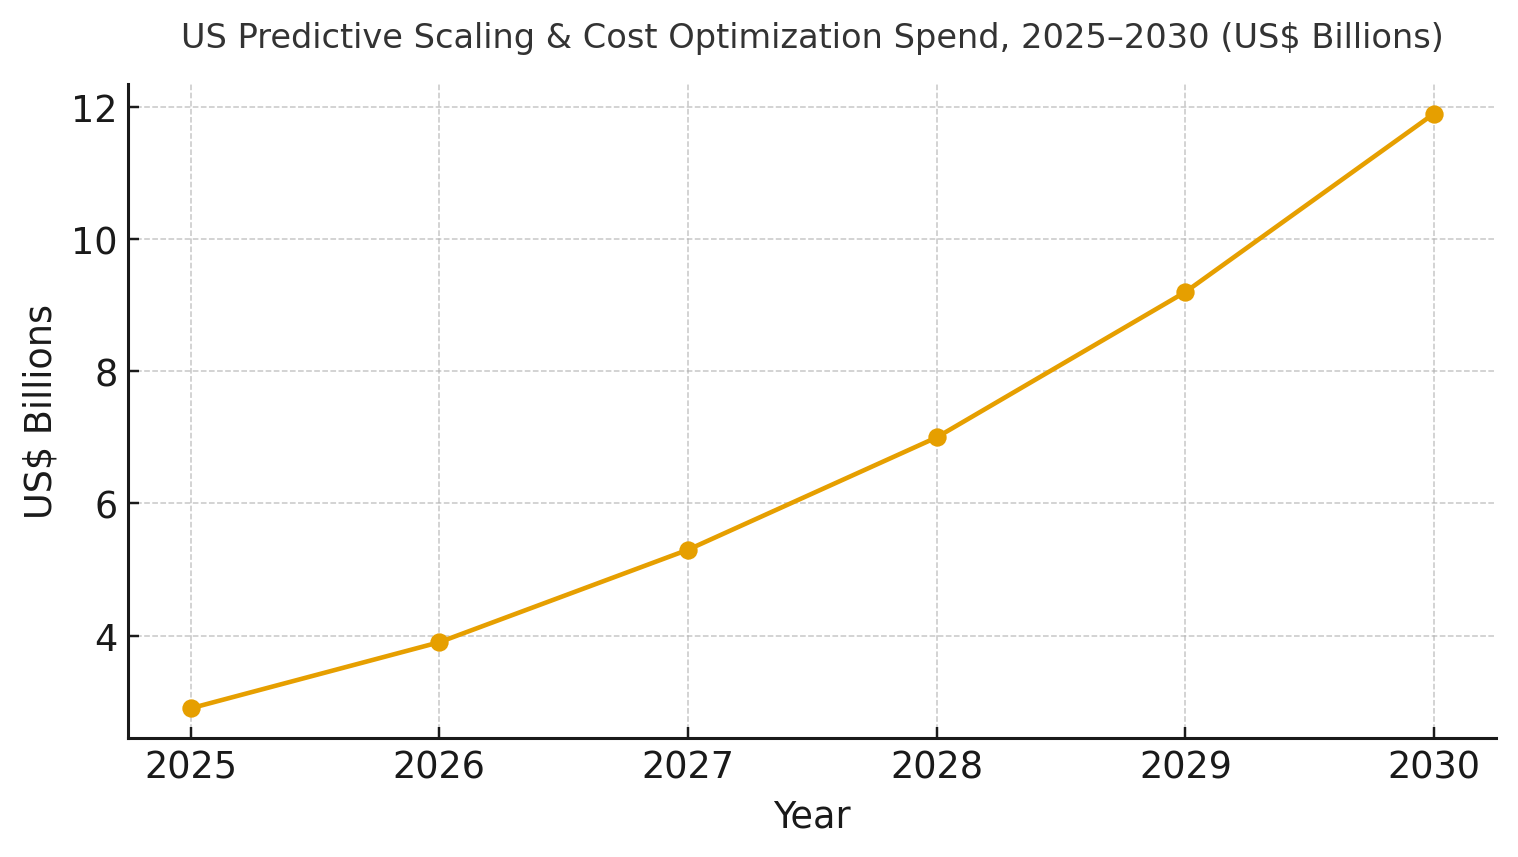
US enterprises are adopting AI-driven resource allocation to align compute, storage, and network capacity with demand in hybrid estates. Spend on predictive scaling and cost optimization is expected to grow from ~$2.9B in 2025 to ~$11.9B by 2030. Key improvements include forecast accuracy (MAPE from 12.0% to 4.2%), reduced compute costs (~US$1.00 to US$0.62), and higher autoscaling success (86% to 97%). SLO violations will drop from ~11.5 to 4.0 per 1,000 deployments, and idle waste will decrease from 26% to 9%. Program IRR will rise from ~9% to ~20%. The architecture includes cross-cloud telemetry, RL optimization, and cost governance. Risks like model drift and shadow workloads are mitigated with explainable recommendations and progressive rollouts. AI-driven allocation will reduce spend volatility and improve feature delivery speed.

What's Covered?
Report Summary
Key Takeaways
1. Forecasting + RL scheduling aligns capacity with demand spikes and troughs.
2. SLO-aware rollouts cut violations per 1k deployments from ~11.5 to ~4.0.
3. Rightsizing + hibernation reduce idle waste from ~26% to ~9%.
4. Egress-aware placement and data locality stabilize unit economics.
5. Explainable recommendations drive engineer trust and automation uptake.
6. GPU/ML capacity optimization becomes a distinct savings lever by 2030.
7. Policy-as-code enforces budgets, SLOs, and data boundaries automatically.
8. CFO dashboard: MAPE %, $/unit, autoscaling %, SLO/1k, idle %, MTTR, IRR.

a) Market Size & Share
US spend on predictive scaling and cost optimization platforms is modeled to grow from ~US$2.9B in 2025 to ~US$11.9B by 2030 as enterprises normalize hybrid cloud operations with policy-as-code and RL scheduling. The line figure shows the trajectory. Share accrues to vendors that deliver accurate forecasts, explainable optimizations, and safe automation integrated with CI/CD. Execution risks: incomplete inventories, untagged resources, and culture barriers. Mitigations: single control planes, tag hygiene, and progressive rollouts with audit trails. Share should be measured via MAPE %, $/unit reduction, autoscaling success %, SLO violations per 1k deploys, idle %, MTTR, and IRR uplift by portfolio.
b) Market Analysis
Quantified improvements make the case for predictive allocation. In our model, MAPE improves ~65%, unit cost falls ~38%, autoscaling success hits ~97%, SLO violations per 1k deploys drop ~65%, idle waste falls to single digits, and MTTR declines by >60%—supporting IRR expansion from ~9% to ~20% by 2030. Enablers: unified telemetry, seasonal forecasting, RL/heuristic schedulers, and egress-aware placement. Barriers: model drift, noisy labels, and fear of automation.
Financial lens: combine hard savings (compute/storage/network) with developer productivity and incident reductions. The bar chart summarizes directional KPI movement under disciplined predictive scaling programs.

c) Trends & Insights
1) Closed-loop policy-as-code governs budgets, SLOs, and placement. 2) Explainable AI becomes mandatory for change management approvals. 3) GPU/ML capacity optimization (bin packing, caching, mixed precision) gains a dedicated budget line. 4) Carbon-aware scheduling aligns optimization with ESG reporting. 5) Data locality and egress-aware routing combat lock-in costs. 6) Forecasting leverages multimodal signals (traffic, releases, marketing, seasonality). 7) Optimization-as-a-service platforms expose APIs to app teams. 8) Canary policies integrate with error budgets to pace automation. 9) Shadow IT detection feeds inventory accuracy. 10) Vendor differentiation shifts to open APIs and exportable recommendations.
d) Segment Analysis
Financial Services: strict SLOs and DR; predictive scaling applied to batch, risk, and customer channels. SaaS/Tech: elasticity and rapid change demand autoscaling with guardrails; focus on CFR, SLO hits, and MTTR. Retail/CPG: seasonality-aware forecasts; edge + central placement. Media/Streaming: bursty traffic and caching optimization. Healthcare/Life Sciences: data residency, lineage, and GPU scheduling for research. Public Sector: predictable budgets and compliance-first policies. Track MAPE %, $/unit, autoscaling %, SLO/1k, idle %, MTTR, IRR by segment.
e) Geography Analysis
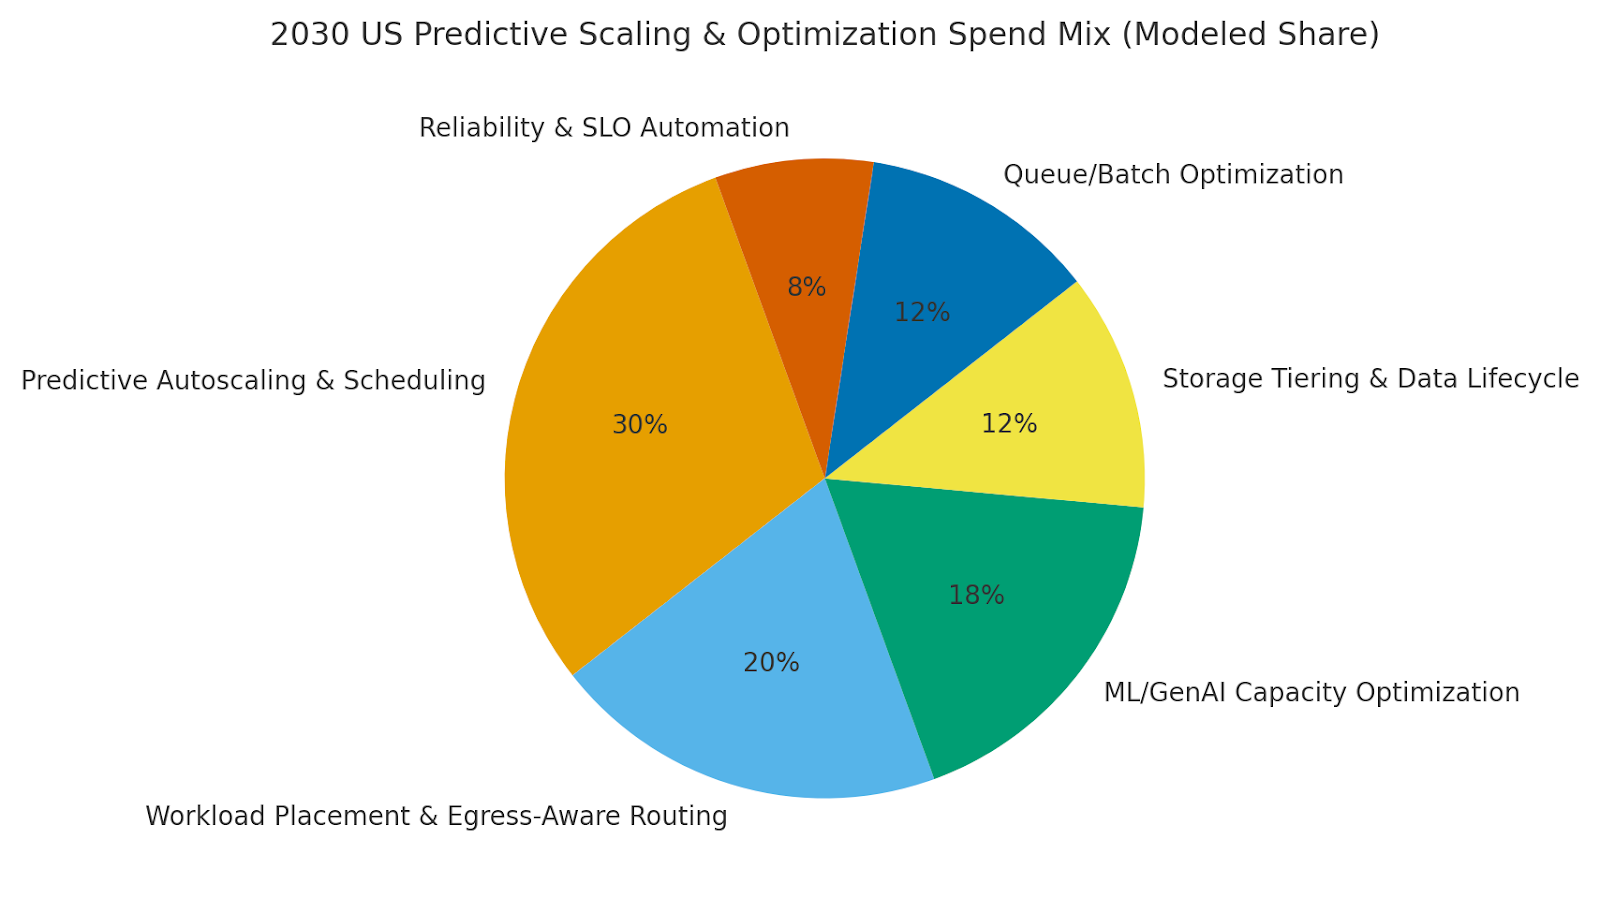
By 2030, we model US spend/use‑case mix as Predictive Autoscaling & Scheduling (~30%), Workload Placement & Egress‑Aware Routing (~20%), ML/GenAI Capacity Optimization (~18%), Storage Tiering & Data Lifecycle (~12%), Queue/Batch Optimization (~12%), and Reliability & SLO Automation (~8%). Major metros with AI‑heavy enterprises lead adoption; regulated regions adopt guardrail‑first rollouts. The pie figure reflects the modeled mix.
Execution: unify telemetry and tags; codify policies; and roll out progressively with SLO gates. Measure region‑specific MAPE %, $/unit, autoscaling %, SLO/1k, idle %, MTTR, and IRR; rebalance spend quarterly.
f) Competitive Landscape
Vendors span cloud providers, optimization platforms, AIOps/SRE suites, and FinOps tools. Differentiation vectors: (1) forecast accuracy and explainability, (2) safe automation integrated with CI/CD and SLOs, (3) GPU/ML optimization depth, (4) egress-aware placement modeling, and (5) time‑to‑value via templates. Procurement guidance: require open APIs, exportable recommendations, audited savings methodology, and rollback safety. Competitive KPIs: MAPE %, $/unit, autoscaling %, SLO/1k, idle %, MTTR, and IRR uplift.
Report Details
Proceed To Buy
Want a More Customized Experience?
- Request a Customized Transcript: Submit your own questions or specify changes. We’ll conduct a new call with the industry expert, covering both the original and your additional questions. You’ll receive an updated report for a small fee over the standard price.
- Request a Direct Call with the Expert: If you prefer a live conversation, we can facilitate a call between you and the expert. After the call, you’ll get the full recording, a verbatim transcript, and continued platform access to query the content and more.
68 Circular Road, #02-01 049422, Singapore
Revenue Tower, Scbd, Jakarta 12190, Indonesia
4th Floor, Pinnacle Business Park, Andheri East, Mumbai, 400093
Cinnabar Hills, Embassy Golf Links Business Park, Bengaluru, Karnataka 560071
Request Custom Transcript
Related Transcripts


68 Circular Road, #02-01 049422, Singapore
Revenue Tower, Scbd, No.52-53, Jakarta 12190, Indonesia
Cinnabar Hills, Embassy Golf Links Business Park, Bengaluru, Karnataka 560071
4th Floor, Pinnacle Business Park, Andheri East, Mumbai, 400093


68 Circular Road, #02-01 049422, Singapore
Revenue Tower, Scbd, Jakarta 12190, Indonesia
4th Floor, Pinnacle Business Park, Andheri East, Mumbai, 400093
Cinnabar Hills, Embassy Golf Links Business Park, Bengaluru, Karnataka 560071