

68 Circular Road, #02-01 049422, Singapore
Revenue Tower, Scbd, Jakarta 12190, Indonesia
4th Floor, Pinnacle Business Park, Andheri East, Mumbai, 400093
Cinnabar Hills, Embassy Golf Links Business Park, Bengaluru, Karnataka 560071


Connect With Us


68 Circular Road, #02-01 049422, Singapore
Revenue Tower, Scbd, Jakarta 12190, Indonesia
4th Floor, Pinnacle Business Park, Andheri East, Mumbai, 400093
Cinnabar Hills, Embassy Golf Links Business Park, Bengaluru, Karnataka 560071
Connect With Us
68 Circular Road, #02-01 049422, Singapore
Revenue Tower, Scbd, Jakarta 12190, Indonesia
4th Floor, Pinnacle Business Park, Andheri East, Mumbai, 400093
Cinnabar Hills, Embassy Golf Links Business Park, Bengaluru, Karnataka 560071
Request Custom Transcript
AI-Driven Cloud Optimization: Enterprise Adoption in Hybrid Environments
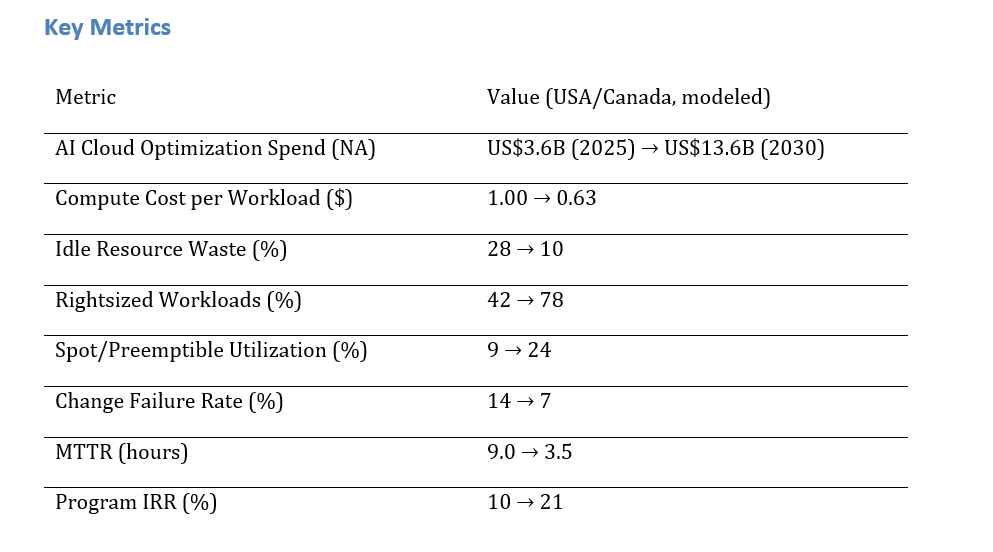
North American enterprises are adopting AI-driven cloud optimization to manage costs, enhance reliability, and accelerate delivery across hybrid estates. Platform and services spend is expected to rise from ~$3.6B in 2025 to ~$13.6B by 2030. Key improvements include a 37% reduction in compute costs, lower idle waste (28% to 10%), increased rightsized workloads (42% to 78%), and faster MTTR (9.0 to 3.5 hours). Program IRR is projected to improve from ~10% to ~21%. The architecture includes telemetry ingestion, RL heuristics, and policy-as-code for budgets and SLAs. Risks like configuration drift and egress lock-in are mitigated with explainable recommendations and data mesh strategies. AI-driven optimization will create self-tuning cloud platforms with measurable cost and performance gains.
What's Covered?
Report Summary
Key Takeaways
1. FinOps + policy‑as‑code embeds budget limits and egress‑aware placement.
2. Rightsizing and scheduled hibernation cut idle waste from ~28% to ~10%.
3. Autonomous scaling + spot usage lowers unit costs without breaching SLOs.
4. Cross‑cloud placement reduces vendor lock‑in and surprise egress charges.
5. SRE automation halves MTTR and stabilizes change velocity.
6. Explainable recommendations increase engineer trust and adoption.
7. Data residency and lineage guardrails keep optimizations compliant.
8. CFO dashboard: $/workload, idle %, rightsized %, spot %, CFR %, MTTR, IRR.
a) Market Size & Share
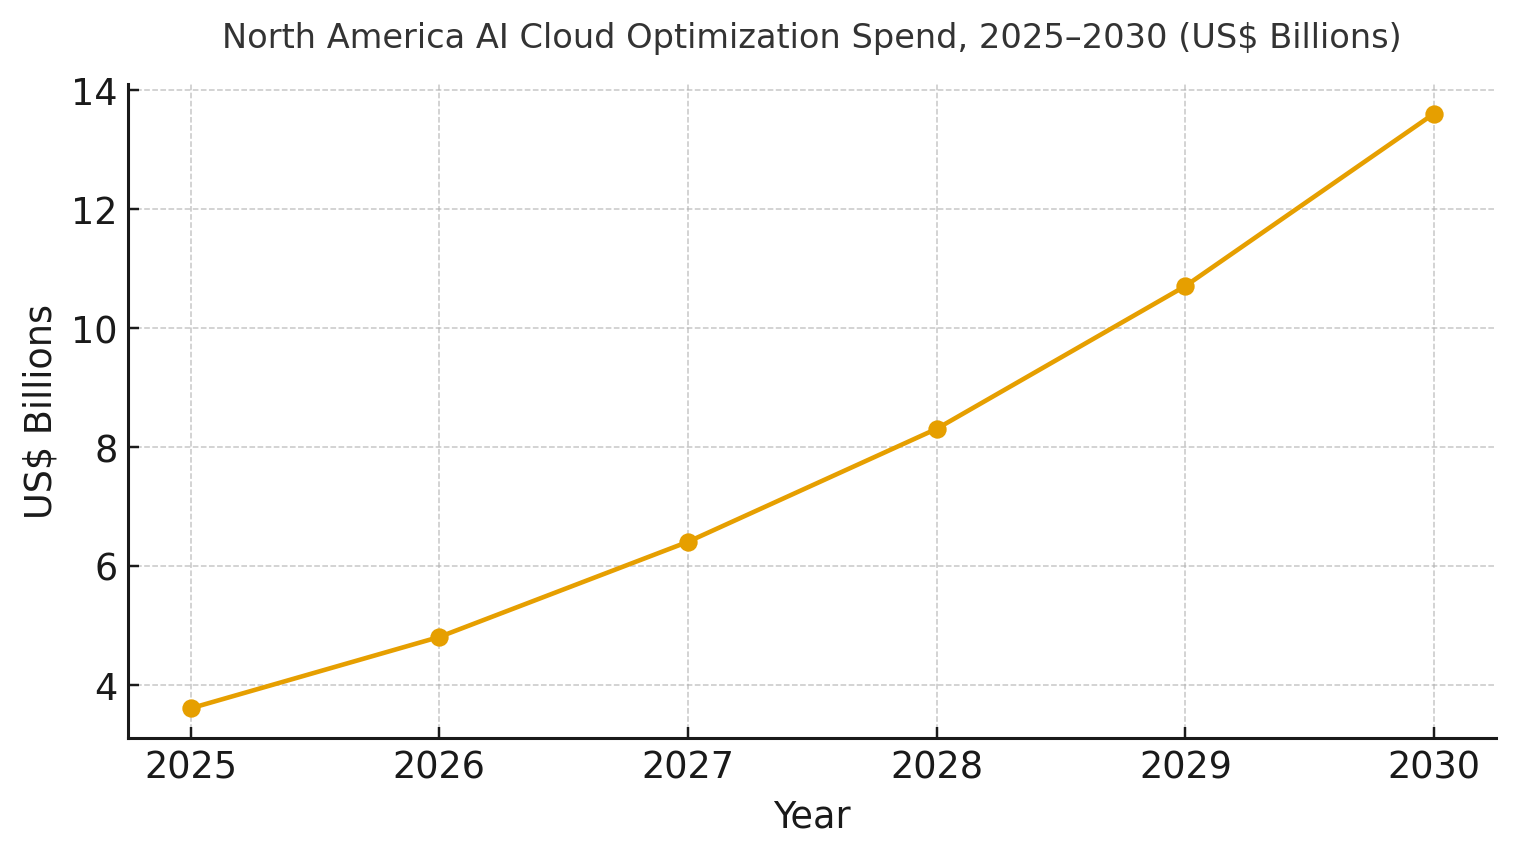
North American spend on AI cloud optimization platforms and services is modeled to grow from ~US$3.6B in 2025 to ~US$13.6B by 2030 as enterprises standardize on FinOps governance paired with autonomous scaling and placement tools. The line figure shows the trajectory. Share accrues to vendors that deliver multi‑cloud coverage, explainable recommendations, and egress‑aware data movement. Execution risks: tool sprawl, weak tagging/telemetry, and cultural resistance to automated changes. Mitigations: single control plane, label hygiene, and staged rollouts with SLO guardrails. Track share via $/workload reduction, idle %, rightsized %, spot %, CFR %, MTTR, and IRR uplift.
b) Market Analysis
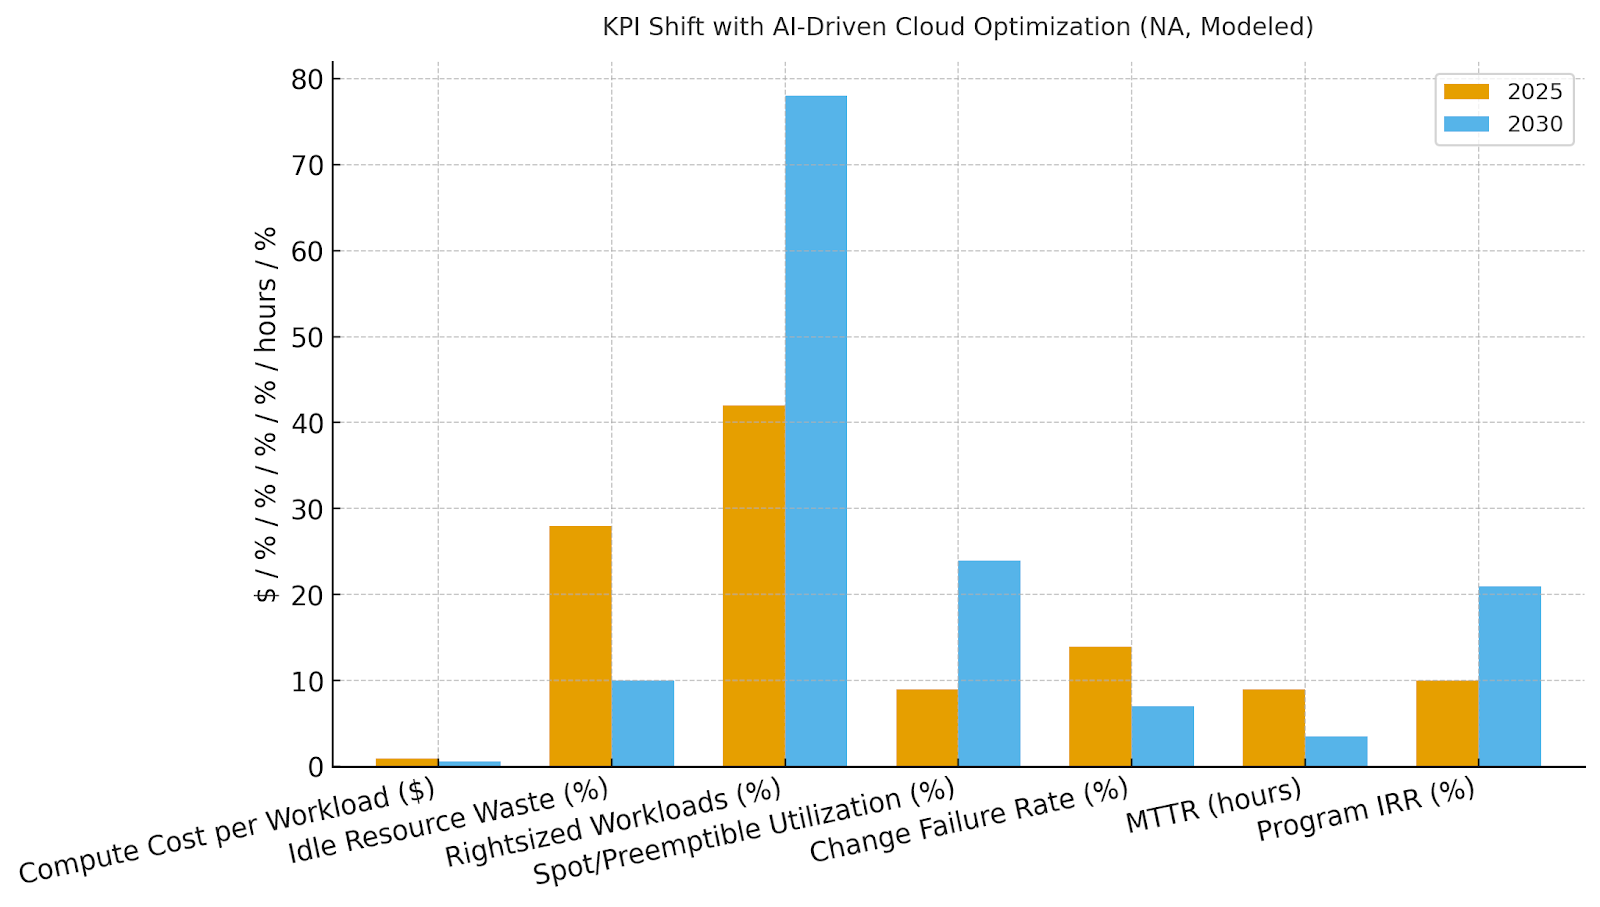
Quantified improvements underpin adoption: compute $/workload falls ~37%, idle waste drops from ~28% to ~10%, rightsized workloads rise to ~78%, spot usage reaches ~24%, CFR halves to ~7%, and MTTR declines to ~3.5 hours, supporting IRR expansion from ~10% to ~21% by 2030. Enablers: unified telemetry, policy‑as‑code, RL‑guided autoscaling, and cross‑cloud placement with egress modeling. Barriers: inconsistent labels, incompatible change processes, and opaque recommendations that erode trust.
Financial lens: combine hard savings (compute/storage/network) with soft gains (developer productivity, fewer incidents). The bar chart summarizes KPI movement under disciplined programs.
c) Trends & Insights
1) FinOps evolves into closed‑loop optimization with policy‑as‑code. 2) Explainable AI recommendations become adoption gatekeepers. 3) Data egress modeling and placement optimization counter lock‑in. 4) GenAI/ML infra optimization (GPU bin‑packing, mixed precision, caching) becomes a dedicated line item. 5) Reliability engineering integrates with optimization—error budgets steer autoscaling and rollout speed. 6) Platform teams expose ‘optimization as a service’ APIs to app teams. 7) Rightsizing shifts from reactive to predictive using seasonality features. 8) Carbon‑aware workload shifting gains traction for ESG targets. 9) Vendor selection prioritizes open APIs and exportable recommendations. 10) Shadow IT discovery via spend and network heuristics feeds governance.
d) Segment Analysis
Financial Services: multi‑region DR and egress‑aware placement; strong guardrails for spot in non‑critical tiers. Healthcare/Life Sciences: data residency and lineage‑aware optimization; GPU scheduling for research workloads. Retail/CPG: traffic seasonality and rapid rightsizing; edge/central placement. SaaS/Tech: autoscaling and SRE automation central; strong focus on CFR and MTTR. Public Sector: policy‑constrained regions and predictable spend. Across segments, define SLOs, budget caps, and rollout policies; track $/workload, idle %, rightsized %, spot %, CFR %, MTTR, and IRR by portfolio.
e) Geography Analysis
By 2030, we model North America optimization spend/use‑case mix as FinOps & Cost Governance (~28%), Autonomous Scaling & Scheduling (~22%), Cross‑Cloud Placement & Egress Minimization (~18%), ML/GenAI Infra Optimization (~16%), Storage Tiering & Lifecycle (~10%), and Reliability & SRE Automation (~6%). US enterprises lead with larger AI/ML estates and multi‑cloud sprawl; Canadian firms emphasize data residency and predictable spend. The pie figure reflects the modeled mix.
Execution: unify telemetry and labels across clouds; codify policies; and phase rollouts by risk. Measure region‑specific $/workload, idle %, rightsized %, spot %, CFR %, MTTR, and IRR; rebalance budgets quarterly.

f) Competitive Landscape
Vendors span cloud providers, optimization platforms, AIOps/SRE suites, and FinOps tools. Differentiation vectors: (1) cross‑cloud coverage with accurate egress modeling, (2) explainable recommendations and policy‑as‑code, (3) GPU/ML optimization depth, (4) reliability integration (SLOs, CFR/MTTR), and (5) time‑to‑value via templates. Procurement guidance: require open APIs, exportable recommendations, audited savings methodology, and rollback safety. Competitive KPIs: $/workload, idle %, rightsized %, spot %, CFR %, MTTR, and IRR uplift.
Report Details
Proceed To Buy
Want a More Customized Experience?
- Request a Customized Transcript: Submit your own questions or specify changes. We’ll conduct a new call with the industry expert, covering both the original and your additional questions. You’ll receive an updated report for a small fee over the standard price.
- Request a Direct Call with the Expert: If you prefer a live conversation, we can facilitate a call between you and the expert. After the call, you’ll get the full recording, a verbatim transcript, and continued platform access to query the content and more.
68 Circular Road, #02-01 049422, Singapore
Revenue Tower, Scbd, Jakarta 12190, Indonesia
4th Floor, Pinnacle Business Park, Andheri East, Mumbai, 400093
Cinnabar Hills, Embassy Golf Links Business Park, Bengaluru, Karnataka 560071
Request Custom Transcript
Related Transcripts


68 Circular Road, #02-01 049422, Singapore
Revenue Tower, Scbd, No.52-53, Jakarta 12190, Indonesia
Cinnabar Hills, Embassy Golf Links Business Park, Bengaluru, Karnataka 560071
4th Floor, Pinnacle Business Park, Andheri East, Mumbai, 400093


68 Circular Road, #02-01 049422, Singapore
Revenue Tower, Scbd, Jakarta 12190, Indonesia
4th Floor, Pinnacle Business Park, Andheri East, Mumbai, 400093
Cinnabar Hills, Embassy Golf Links Business Park, Bengaluru, Karnataka 560071