

68 Circular Road, #02-01 049422, Singapore
Revenue Tower, Scbd, Jakarta 12190, Indonesia
4th Floor, Pinnacle Business Park, Andheri East, Mumbai, 400093
Cinnabar Hills, Embassy Golf Links Business Park, Bengaluru, Karnataka 560071


Connect With Us


68 Circular Road, #02-01 049422, Singapore
Revenue Tower, Scbd, Jakarta 12190, Indonesia
4th Floor, Pinnacle Business Park, Andheri East, Mumbai, 400093
Cinnabar Hills, Embassy Golf Links Business Park, Bengaluru, Karnataka 560071
Connect With Us
68 Circular Road, #02-01 049422, Singapore
Revenue Tower, Scbd, Jakarta 12190, Indonesia
4th Floor, Pinnacle Business Park, Andheri East, Mumbai, 400093
Cinnabar Hills, Embassy Golf Links Business Park, Bengaluru, Karnataka 560071
Request Custom Transcript
Agile Fashion Supply Chains: Nearshoring Strategies & Multi-Sourcing Risk Mitigation
From 2025 to 2030, North American fashion brands pivot from single‑country, ocean‑freight‑dependent models to hybrid sourcing that pairs nearshore speed with offshore scale. The aim is to balance cost and agility: offshore Asia remains a base for long‑lead basics, while Mexico, Central America, Caribbean hubs, and US on‑shore lines absorb volatile and trend‑sensitive demand. Our illustrative outlook shows nearshored production value rising from ~$31 bn in 2025 to ~$106 bn by 2030, with mass‑market programs growing from ~$22 bn→$72 bn and premium/athletic from ~$9 bn→$34 bn. Lead times compress from ~65–80 days offshore to ~18–28 days nearshore by 2030 as pre‑positioned greige, modular cutting, and consolidated cross‑dock flows mature. Gross margin uplift is realized through fewer markdowns and higher full‑price sell‑through rather than absolute $/unit cost reduction.
What's Covered?
Report Summary
Key Takeaways
1. Nearshore wins on agility economics—fewer markdowns and lower obsolescence outweigh modest $/unit premiums.
2. Pre‑positioned greige, modular cutting, and border DC cross‑docks compress PO‑to‑DC to ~18–28 days by 2030.
3. Dual‑sourcing and yarn‑forward alternatives reduce vendor and country concentration risk.
4. Regional fabric mills and standardized trims unblock speed; diversify dye/finish capacity to avoid bottlenecks.
5. Outcome‑based SLAs (OTIF, cycle‑time, defect ppm) align incentives; VMI and consignment ease cash cycles.
6. Digitized demand sensing at SKU/door level shrinks safety stock 15–30 days and lifts sell‑through 3–6 pp.
7. ESG guardrails (traceability, ZDHC, water/energy KPIs) become contract essentials and brand risk hedges.
8. Near shore portfolios must be capacity‑right‑sized and seasonally flexed to maintain >70% utilization.
Key Metrics

Market Size & Share
Nearshoring scales fastest where demand volatility and trend cadence punish long lead times. In this illustrative outlook, North American nearshored apparel value grows from ~$31 bn in 2025 to ~$106 bn by 2030, with mass‑market lines expanding ~3.3× and premium/athletic lines ~3.8× as programs move from pilots to enterprise portfolios. Mass captures the larger dollar share—basic knits, fleeces, tees, denim—once greige is staged regionally and cutting modules operate close to border DCs. Premium/athletic grows on capsule drops, performance knits, and smaller batch sizes that reward speed and quality control.
Share consolidates around vendor clusters with vertically integrated dye/finish and elastic capacity. US near‑border cross‑dock nodes (TX, CA) and Mexican hubs (Monterrey, Bajío) gain share through frequent milk‑runs and reliable linehaul. Central America and the Caribbean broaden access to duty‑free programs and specialty sewing, particularly for swimwear/athleisure. By 2030, brands with hybrid portfolios—offshore for scale, nearshore for speed—command higher full‑price sell‑through and lower inventory risk versus single‑lane peers.

Market Analysis
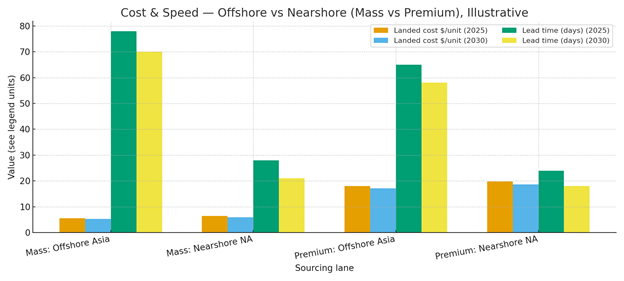
The economic hinge is not $/unit alone; it is total system margin. Our illustrative comparison shows nearshore mass landed cost at ~$6.4→$6.0/unit vs offshore ~$5.6→$5.3 by 2030; premium nearshore at ~$19.8→$18.6 vs offshore ~$18.0→$17.2. Yet lead time advantages (nearshore ~18–28 days vs offshore ~58–78) cut markdowns 3–6 pp and reduce safety stock by 15–30 days, typically eclipsing the cost delta. The TCO model should incorporate demand volatility, dwell cost, and obsolescence alongside labor and freight.
Risk: capacity fragmentation, dye/finish bottlenecks, and labor availability. Mitigations: pre‑positioned greige; regional mill partnerships; dual‑vendor BOMs; standardized trims; and border DC consolidation. Contracting shifts to outcome‑based SLAs—OTIF, cycle‑time, ppm defects—with incentives for weekly refresh cadence. Digitized planning (SKU, door, weather/event signals) aligns cuts to localized demand; VMI and consignment terms improve cash velocity without starving suppliers.
Trends & Insights (2025–2030)
• Pre‑positioned greige and dye‑on‑demand shorten cycles for fashion and replenishment basics.
• Modular cutting/sewing cells near border DCs support weekly refresh and localized size curves.
• Vendor‑managed inventory and consignment finance speed while protecting brand working capital.
• Digital twins of supply nodes forecast capacity, reveal bottlenecks, and tune line balancing.
• ESG assurance tightens: fiber traceability, ZDHC conformance, recycled inputs, and water/energy KPIs.
• Trade frameworks (USMCA/CAFTA‑DR) and tariff strategy (yarn‑forward alternatives) shape net landed cost.
• Robotics/automation rise in cutting and material movement; human skill remains decisive in finishing.
• Border logistics: fast‑lane programs, pre‑clearance, and cross‑dock orchestration reduce dwell and variability.
Segment Analysis
• Mass Market: basics, graphic tees, fleece, denim—large volumes benefit from pre‑positioned greige and frequent replenishment; focus on dye/finish capacity and trim standardization.
• Premium/Luxury & Athletic: smaller batches, higher CM value, performance knits; place capacity near QA talent and specialized finishing; speed protects brand equity and full‑price sell‑through.
• Private Label Retailers: inventory risk is central; nearshore for seasonal and promotional capsules; keep offshore for known‑stable basics.
• DTC & Omnichannel: leverage nearshore for rapid A/B testing and localized assortments; integrate PLM‑to‑WMS to enable weekly drops.
Buyer guidance: segment SKUs by volatility and margin; allocate nearshore capacity to SKUs where markdown avoidance and DoS reduction exceed $/unit premium; stage vendor ecosystems to dual‑source key styles and trims; and secure dye/finish redundancy to prevent single‑point bottlenecks.
Geography Analysis (North America Nearshore)
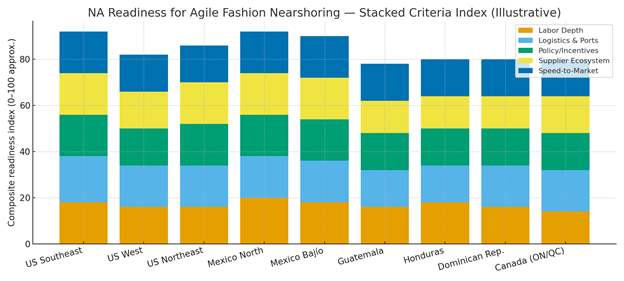
Readiness concentrates along US border logistics (TX/CA cross‑dock belts), Northern Mexico (Monterrey, Coahuila, Chihuahua), the Bajío, and CAFTA‑DR nodes (Guatemala, Honduras, Dominican Republic). The stacked criteria—labor depth, logistics/ports, policy/incentives, supplier ecosystem, and speed‑to‑market—show where balanced capabilities convert purchase orders into reliable weekly refreshes. US Southeast captures on‑shore knit/cut pilots backed by automation and quick QA loops; Canada’s Ontario/Quebec contribute specialty knits and proximity to Northeast DCs.
Implications: anchor portfolios near proven dye/finish capacity; build cross‑dock and pre‑clearance routines; and maintain dual‑vendor BOMs across Mexico + CAFTA‑DR to hedge weather, policy, and labor shocks while sustaining utilization.
Competitive Landscape (Vendors, 3PLs & Platforms)
Competition spans vertically integrated Mexican groups, CAFTA‑DR specialty sewers, US on‑shore cutting/automation startups, fabric mills, and 3PLs with border cross‑dock networks. Differentiators: cycle time to DC, dye/finish elasticity, SLA adherence (OTIF, ppm), and ESG verification. Retailers and brands increasingly award multi‑year, outcome‑indexed contracts with volume corridors, seasonal flex bands, and co‑investment in greige and automation. Platforms that integrate PLM, order orchestration, WMS/TMS, and vendor telemetry become table stakes for CFO‑grade visibility. Expect consolidation around dye/finish capacity and border logistics. Winners will pair cost control with speed, publish telemetry (OTIF, cycle time, defects), and deliver resilient multi‑sourcing that keeps utilization above 70% while protecting brand margins.
Report Details
Proceed To Buy
Want a More Customized Experience?
- Request a Customized Transcript: Submit your own questions or specify changes. We’ll conduct a new call with the industry expert, covering both the original and your additional questions. You’ll receive an updated report for a small fee over the standard price.
- Request a Direct Call with the Expert: If you prefer a live conversation, we can facilitate a call between you and the expert. After the call, you’ll get the full recording, a verbatim transcript, and continued platform access to query the content and more.
68 Circular Road, #02-01 049422, Singapore
Revenue Tower, Scbd, Jakarta 12190, Indonesia
4th Floor, Pinnacle Business Park, Andheri East, Mumbai, 400093
Cinnabar Hills, Embassy Golf Links Business Park, Bengaluru, Karnataka 560071
Request Custom Transcript
Related Transcripts


68 Circular Road, #02-01 049422, Singapore
Revenue Tower, Scbd, No.52-53, Jakarta 12190, Indonesia
Cinnabar Hills, Embassy Golf Links Business Park, Bengaluru, Karnataka 560071
4th Floor, Pinnacle Business Park, Andheri East, Mumbai, 400093


68 Circular Road, #02-01 049422, Singapore
Revenue Tower, Scbd, Jakarta 12190, Indonesia
4th Floor, Pinnacle Business Park, Andheri East, Mumbai, 400093
Cinnabar Hills, Embassy Golf Links Business Park, Bengaluru, Karnataka 560071