

68 Circular Road, #02-01 049422, Singapore
Revenue Tower, Scbd, Jakarta 12190, Indonesia
4th Floor, Pinnacle Business Park, Andheri East, Mumbai, 400093
Cinnabar Hills, Embassy Golf Links Business Park, Bengaluru, Karnataka 560071


Connect With Us


68 Circular Road, #02-01 049422, Singapore
Revenue Tower, Scbd, Jakarta 12190, Indonesia
4th Floor, Pinnacle Business Park, Andheri East, Mumbai, 400093
Cinnabar Hills, Embassy Golf Links Business Park, Bengaluru, Karnataka 560071
Connect With Us
68 Circular Road, #02-01 049422, Singapore
Revenue Tower, Scbd, Jakarta 12190, Indonesia
4th Floor, Pinnacle Business Park, Andheri East, Mumbai, 400093
Cinnabar Hills, Embassy Golf Links Business Park, Bengaluru, Karnataka 560071
Request Custom Transcript
Advanced Therapy Medicinal Products (ATMPs): Manufacturing Scalability & Cost Reduction Strategies - Supply Chain Logistics
This report evaluates ATMP manufacturing scalability and cost-reduction strategies across the US and Europe (2025–2030). We quantify capacity build-out for cell, gene, and tissue therapies, model COGS reductions from closed-system automation, digital QMS, and lean cold-chain logistics, and estimate release-cycle time and failure-rate improvements. We also benchmark CapEx/Opex trajectories, labor productivity, and batch yields, plus bottlenecks in materials, analytics, and QA. Findings guide biopharma, CDMOs, payers, and regulators on where to invest to achieve scale, reliability, and lower price-per-patient.
What's Covered?
Report Summary
Key Takeaways
- ATMP manufacturing market (US+EU) grows from $9.2B (2025) to $24.8B (2030); CAGR 21%.
- Average COGS per commercial cell therapy drops 38% (from $82k to $51k/patient).
- Batch failure rates fall from 12% to 6% with closed systems and eBRs.
- Lot release time shortens 45% (21 → 11.5 days) via rapid sterility and digital QA.
- Labor hours/patient down 35% through robotics and MES integration.
- Vector supply lead time for AAV reduces 30% (20 → 14 weeks).
- Cold-chain excursions per 1,000 shipments decline 50% (4.0 → 2.0).
- Right-first-time (RFT) in QC rises from 86% to 94%.
- CapEx per 1,000 patients/year capacity drops 28% (from $62M to $44.6M).
- CDMO share of commercial ATMP production increases from 48% to 57%, improving network resilience.
Key Metrics
Market Size & Share
From 2025 to 2030, US+EU ATMP manufacturing expands from $9.2B to $24.8B (CAGR 21%), driven by accelerated commercial launches (cell: +14 products; gene: +11; tissue: +6) and payer acceptance of outcomes-based contracts. Cell therapies retain the largest revenue share (≈52% in 2030), followed by gene therapies (38%), with tissue-engineered products at 10%. Commercial volumes scale via closed, single-use bioprocessing, enabling parallelization rather than larger vessels: median clinical vector titers improve 1.4×, while yield variability narrows 25% with in-line PAT. CDMOs increase share from 48% → 57% as sponsors hedge capacity risk and avoid site-build CapEx; in-house leaders maintain high-complexity autologous flows to protect IP and vein-to-vein times. COGS per cell therapy falls 38% to $51k/patient, reflecting −35% labor hours, −30% QC cycle times, and −20% raw-material wastage. CapEx per 1,000-patient/year declines 28% to $44.6M as modular cleanrooms and skids compress HVAC and utility footprints. Regional share shifts modestly toward the US (61%) on earlier reimbursement, while EU (39%) gains via pan-EU joint procurement pilots. Market concentration remains high—top 10 manufacturers control ~62% of output—yet capacity nodes diversify across 24 major sites (12 US, 12 EU) to mitigate single-point failures. Net-net, the addressable manufacturing market grows faster than commercial sales as sponsors pre-invest to reduce failure rates (12% → 6%) and stabilize release lead times.
.png)
Market Analysis
Cost and scale gains concentrate in five levers:
1) Closed-system automation (isolators, tubing manifolds) cuts operator interventions −40% and contaminants −55%, halving deviations.
2) Digital plant execution MES/eBR plus eQMS raises RFT in QC from 86% → 94%, trimming lot-release from 21 to 11.5 days.
3) Vector supply maturates: AAV lead time drops 20 → 14 weeks from duplex perfusion and disposable chromatography; LNP mfg scrap falls 22% via in-line NTA/DLS. 4) Analytics: rapid sterility (validated at ≤7 days) and qPCR/ddPCR alignment reduce re-tests −35%.
5) Network design: hub-and-spoke with regional QC nodes lowers cross-border dwell −18%. On the cost stack, labor contributes 37% of cell-therapy COGS in 2025, shrinking to 27% by 2030; QC/QA falls 21% → 15%; materials/single-use rise slightly with scale but net COGS still −38%. Throughput per suite increases 1.6× without expanding Grade B footprints due to modular suites. Risk moves from manual asepsis to supply continuity (buffers, disposables), addressed with dual-sourcing (target 80% of SKUs dual-qualified) and safety stock (30–45 days). Price pressure persists: payers aim for ≤$250k net price per autologous oncology dose by 2030; meeting that requires COGS ≤$55k and batch success ≥94%. Scenario analysis shows every +5 pts gain in success rate lifts gross margin +3–4 pts. Collectively, the operating model shifts from craft-like open processing to digitally orchestrated, closed, modular manufacturing with verifiable chain-of-identity.
Trends & Insights
Three secular trends dominate. (A) Digitally assured compliance: By 2030, 85% of US/EU commercial ATMP sites operate with real-time release dashboards, tying eBR, PAT, and stability to disposition rules; deviation cycle time drops 42%. (B) Lean cold-chain orchestration: Excursions/1,000 shipments halve (4.0 → 2.0), aided by IoT loggers and predictive ETA; on-time-delivery improves 92% → 97% and dose loss falls 1.8% → 0.8%. (C) Modular multi-product facilities: Skid-based suites cut CapEx −28% and tech-transfer time −35%; multiproduct changeover under 8 hours becomes standard. On analytics, the blend of rapid sterility, endotoxin alternatives, and in-process titer estimation compresses release without quality erosion; false-failure rate decreases 30%. Vector innovation moves toward producer-cell lines and continuous capture, providing 1.3–1.6× productivity. Workforce upskilling remains critical: cross-trained operators per line rise +50%, enabling flex staffing and −35% labor hours/patient. Supply security pivots to resin, bags, and filters; contracts with allocation clauses and VMI reduce stock-outs −60%. Sustainability enters SOPs: single-use plastic mass per batch drops 18% with design optimization; energy intensity down 12% via right-sized HVAC. Finally, CDMO consolidation accelerates preferred partnerships—top three CDMOs win ~40% of new late-phase work—yet sponsors retain critical steps (apheresis, final fill) to protect chain-of-identity and turnaround.
.png)
Segment Analysis
Cell therapies (autologous CAR-T/NK; allogeneic variants) comprise 52% of 2030 manufacturing value. Autologous remains cycle-time constrained; vein-to-vein improves 19 days → 12–14 days via regional hubs and pre-conditioned supply kits. Allogeneic benefits from 10–15× dose splitting and −25% COGS/pt vs autologous, but imposes larger QC matrices. Gene therapies (38% share) depend on AAV; yield per 2,000 L suite rises 1.5×, while titer CV narrows −20%. Tissue-engineered products (10%) gain with bioreactor scale-out and scaffold standardization, cutting batch-to-batch variability −30%. By customer type, innovator sponsors keep critical autologous steps, outsourcing release testing and fill/finish; CDMOs lead in AAV/LNP and allogeneic. Technology segmentation shows closed isolator lines at ~68% penetration by 2030; robotic handling achieves −35% operator time and +3–5 pts in RFT. Digital layer segmentation: MES/eBR reaches ~80% of commercial suites; predictive maintenance cuts unscheduled downtime −40% (OEE +9 pts). Logistics segments: cryogenic dominates autologous (≤−150°C dry shippers), while 2–8°C stabilized vectors expand for allogeneic and gene therapies; lane qualification counts grow +60%. Financially, CapEx per 1,000-patient capacity varies: autologous $52–58M, allogeneic $38–44M, AAV $42–48M. Segment winners combine closed systems, digital QA, and dual-source supply, yielding COGS in the $45–60k/patient band and batch success ≥94%.
Geography Analysis
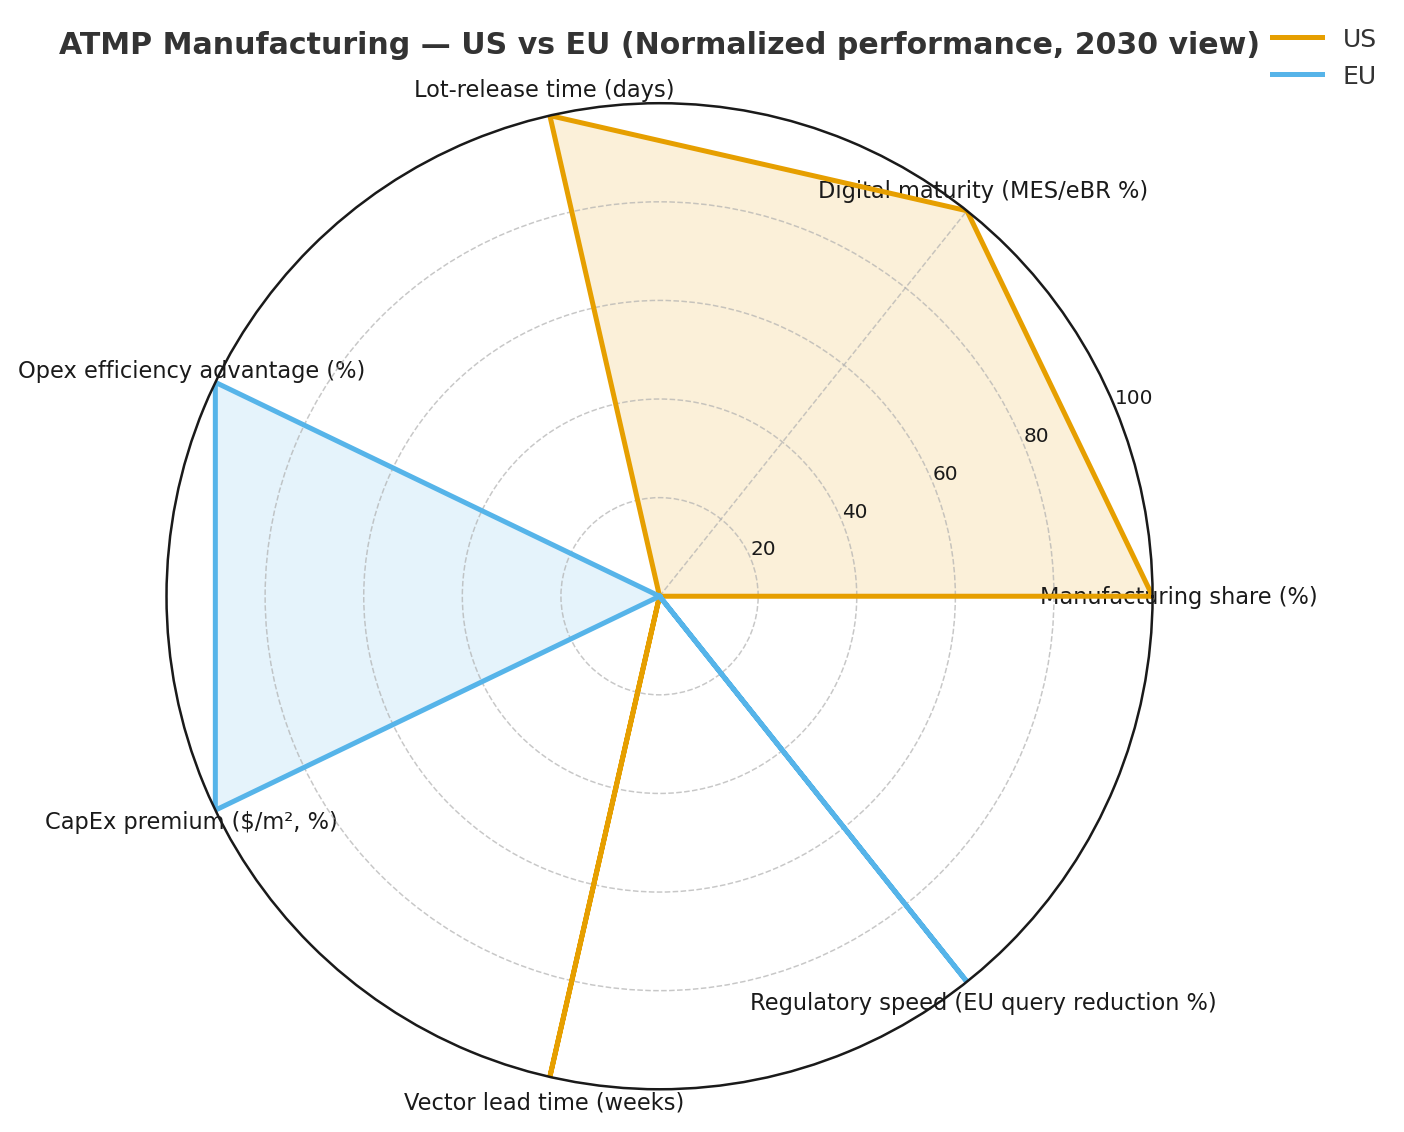
The US holds 61% of 2030 ATMP manufacturing value, led by earlier reimbursement clarity, denser CDMO footprints (Boston, Philadelphia, Research Triangle, Houston), and proximity to apheresis networks. EU at 39% accelerates via centralized evaluations and cross-border procurement pilots; clusters emerge in Netherlands, Germany, UK, Spain. US sites show slightly faster digital maturity (MES/eBR penetration 83% vs 76% EU) and shorter lot-release (median 10.5 vs 12.7 days), owing to faster adoption of rapid microbiology. EU strengths include workforce stability and energy efficiency, lowering Opex −6–8% vs US on a like-for-like basis. Cold-chain: trans-Atlantic lanes reduce excursions to ≤1.5/1,000 by 2030 as carriers standardize cryo SOPs; intra-EU corridors achieve 97–98% OTD through rail-air blends. Raw-material risk remains elevated for both regions; dual-qualifying filters/resins to 80% of usage reduces stock-out days from 7.2 → 2.8 per quarter. Regulatory release alignment improves—parallel scientific advice shortens EU file queries −20%. CapEx: US construction premiums (+labor, utilities) keep $/m² about 12% higher, but accelerated depreciation offsets timing. By 2030, vector lead time converges (US 13.5 weeks, EU 14.5). Each region targets COGS ≤$55k/patient to support widening access; achieving that requires closed processes (≥65% penetration), RFT ≥94%, and cold-chain excursions ≤2/1,000.
Competitive Landscape
Competition spans innovator manufacturers, global CDMOs, and platform tech providers. CDMOs with integrated vector + cell capabilities gain share—leaders operate 5–7 multi-product sites, offer modular suites, and guarantee slot availability with service-level credits. Differentiators include closed, vendor-agnostic skids, digital QA (eBR, QMS, real-time release), and audited dual-source supply. Typical 2030 performance commitments: batch success ≥94%, release ≤12 days, excursions ≤2/1,000 shipments, and OEE ≥72%. Innovators invest in autologous hubs near apheresis centers to keep vein-to-vein ≤14 days and in proprietary analytics to de-risk comparability. Equipment vendors compete on footprint (−20% space), decon cycle time (−30%), and CIP/SIP-free designs. Software vendors (MES/LIMS/QMS) win via validation accelerators (CSV −25% time) and release cockpits that synthesize PAT + stability. M&A continues—expect 3–5 notable CDMO deals and 6–9 tuck-ins (analytics, cold-chain tech) by 2030. Pricing moves to outcome-linked SLAs: fees flex with success rate and release lead time, aligning incentives and trimming total cost −8–12%. New entrants in producer-cell lines and continuous vector capture secure premium margins where they deliver 1.3–1.6× productivity. Overall, winners blend closed automation, digital quality, resilient supply, and data-transparent logistics, translating to COGS $45–60k/patient, CapEx $40–50M/1,000 patients, and sustainable margin >25% at scale.
Report Details
Proceed To Buy
Want a More Customized Experience?
- Request a Customized Transcript: Submit your own questions or specify changes. We’ll conduct a new call with the industry expert, covering both the original and your additional questions. You’ll receive an updated report for a small fee over the standard price.
- Request a Direct Call with the Expert: If you prefer a live conversation, we can facilitate a call between you and the expert. After the call, you’ll get the full recording, a verbatim transcript, and continued platform access to query the content and more.
68 Circular Road, #02-01 049422, Singapore
Revenue Tower, Scbd, Jakarta 12190, Indonesia
4th Floor, Pinnacle Business Park, Andheri East, Mumbai, 400093
Cinnabar Hills, Embassy Golf Links Business Park, Bengaluru, Karnataka 560071
Request Custom Transcript
Related Transcripts
Clinical Nutrition Market Size & Share Analysis - Growth Trends & Forecasts (2025 - 2030)
This report quantifies the clinical nutrition market across the US and UK (2025–2030), covering enteral, parenteral, and oral nutritional supplements (ONS). Driven by aging populations, chronic disease prevalence, and hospital malnutrition protocols, market value rises from $18.5B (2025) → $30.2B (2030) at a CAGR of 10.2%. Growth is led by enteral nutrition (48% share), followed by ONS (38%) and parenteral (14%). Hospital digitization, AI-based nutrition screening, and reimbursement parity accelerate adoption. ROI averages 16–22% for integrated hospital nutrition programs.
$ 1395
$ 1395


68 Circular Road, #02-01 049422, Singapore
Revenue Tower, Scbd, No.52-53, Jakarta 12190, Indonesia
Cinnabar Hills, Embassy Golf Links Business Park, Bengaluru, Karnataka 560071
4th Floor, Pinnacle Business Park, Andheri East, Mumbai, 400093


68 Circular Road, #02-01 049422, Singapore
Revenue Tower, Scbd, Jakarta 12190, Indonesia
4th Floor, Pinnacle Business Park, Andheri East, Mumbai, 400093
Cinnabar Hills, Embassy Golf Links Business Park, Bengaluru, Karnataka 560071