

68 Circular Road, #02-01 049422, Singapore
Revenue Tower, Scbd, Jakarta 12190, Indonesia
4th Floor, Pinnacle Business Park, Andheri East, Mumbai, 400093
Cinnabar Hills, Embassy Golf Links Business Park, Bengaluru, Karnataka 560071


Connect With Us


68 Circular Road, #02-01 049422, Singapore
Revenue Tower, Scbd, Jakarta 12190, Indonesia
4th Floor, Pinnacle Business Park, Andheri East, Mumbai, 400093
Cinnabar Hills, Embassy Golf Links Business Park, Bengaluru, Karnataka 560071
Connect With Us
68 Circular Road, #02-01 049422, Singapore
Revenue Tower, Scbd, Jakarta 12190, Indonesia
4th Floor, Pinnacle Business Park, Andheri East, Mumbai, 400093
Cinnabar Hills, Embassy Golf Links Business Park, Bengaluru, Karnataka 560071
Request Custom Transcript
6G Network Infrastructure: R&D Investment Analysis & Global Standardization Roadmaps
Europe and the UK are advancing 6G from pilot projects to coordinated programs focused on sub-THz radio innovation, cloud-native cores, AI automation, and open testbeds. 6G R&D spending is projected to grow from ~$7.0B in 2025 to ~$18.2B by 2030. Key enablers, like sub-THz radios and AI-driven management, will advance from TRL4 to TRL6.5, improving interoperability and reducing prototype timelines. Patent momentum and spectrum readiness will increase, while program IRR improves from ~7% to ~14%. Strategic spending focuses on radio/waveforms, core/cloud-native technology, and AI/automation. Risks include fragmented IP and talent bottlenecks, mitigated by shared testbeds and skills pipelines. The Europe/UK 6G program is set to drive commercialization between 2027 and 2030.
What's Covered?
Report Summary
Key Takeaways
1. R&D spend scales to ~US$18.2B by 2030, anchored by Europe/UK programs.
2. TRL advances (4→6.5) and halved prototyping time accelerate transfer to 3GPP.
3. Interoperability pass rates (~62%→~86%) reflect maturing open testbeds.
4. Radio & core/cloud‑native capture ~48% of 2030 budgets; AI/automation ~18%.
5. Patent velocity (index 185) signals pre‑standard IP positioning and FRAND stakes.
6. Spectrum readiness rises as coexistence & sensing frameworks solidify.
7. Security/privacy R&D (~12%) targets zero‑trust, PQ crypto, and trusted AI.
8. CFO dashboard: TRL, interop %, TTP months, patents index, spectrum score, IRR.

a) Market Size & Share
Europe/UK 6G R&D investment is modeled to expand from ~US$7.0B in 2025 to ~US$18.2B by 2030, reflecting scaled public–private programs that target radio innovation, cloud‑native cores, and AI‑enabled automation. The line figure shows the trajectory. Share concentrates with actors who (1) ship reusable modules that cut time‑to‑prototype, (2) publish open APIs for testbed portability, and (3) align outputs to 3GPP/ETSI milestones. Risks include fragmented funding and IP contention; mitigations: joint calls, FRAND clarity, and shared testbeds. Track share by patent velocity, TRL gains, interop %, and pre‑standard revenue from 5G‑Advanced bridges.

b) Market Analysis
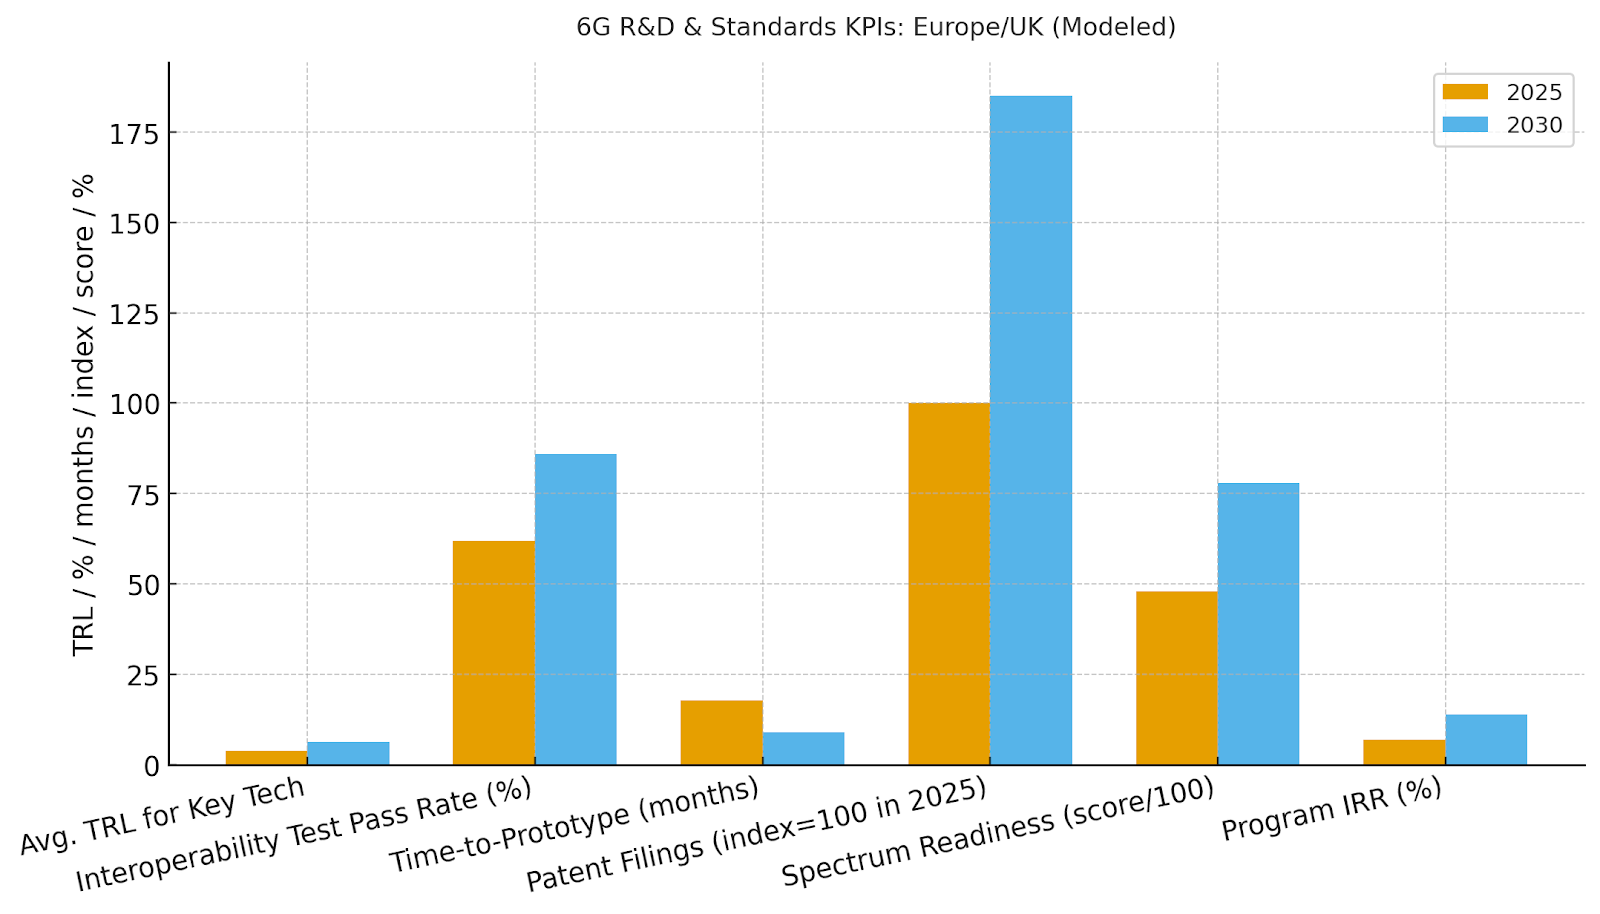
Quantitative signals—higher TRL, better interop %, faster prototyping, stronger patenting, and spectrum readiness—correlate with commercialization timing. We model TRL rising 4.0→6.5, interop pass rates 62→86%, time‑to‑prototype 18→9 months, patent index 100→185, spectrum readiness score 48→78, and program IRR 7→14% by 2030. Enablers: open RAN testbeds, RIC/xApps AI automation, cloud‑native core microservices, and sub‑THz channel models. Barriers: talent shortages, fragmented IP, and uneven spectrum timelines.
Financial lens: earlier monetization via 5G‑Advanced features (sensing, uplink boosts, AI ops) funds late‑stage 6G R&D. Portfolio KPIs: patents per $100M, prototype cycle time, interop outcomes, and spectrum pilots. The bar chart summarizes directional KPI improvements under disciplined programs.
c) Trends & Insights
1) AI‑native networks: RIC/xApps and core analytics automate configuration, energy use, and anomaly response. 2) Joint communication‑sensing: location, imaging, and presence become native services. 3) Cloud‑native core everywhere: microservices and CI/CD pipelines for faster standards conformance. 4) Sub‑THz exploration with reconfigurable surfaces extends capacity and precision. 5) Open, portable testbeds—university/industry—become the proving ground for interoperability. 6) Security by design: PQ cryptography, confidential compute, and supply‑chain attestations. 7) Sustainability KPIs move to the front‑page of standards. 8) Pre‑standard commercialization via 5G‑Advanced bridges de‑risks 6G rollouts.
d) Segment Analysis
Telecom Operators: prioritize automation, spectrum pilots, and energy KPIs. OEMs & Silicon: invest in RF front‑ends, antennas, and AI accelerators. Hyperscalers: co‑develop cloud‑native cores and analytics. Academia & Labs: drive sub‑THz and sensing breakthroughs; host interop events. Standards Bodies & Consortia: align milestones and certification. Across segments, measure TRL progress, interop %, prototype cycle time, and patents. Revenue bridges: licensing, pre‑standard features, and managed automation services.
e) Geography Analysis
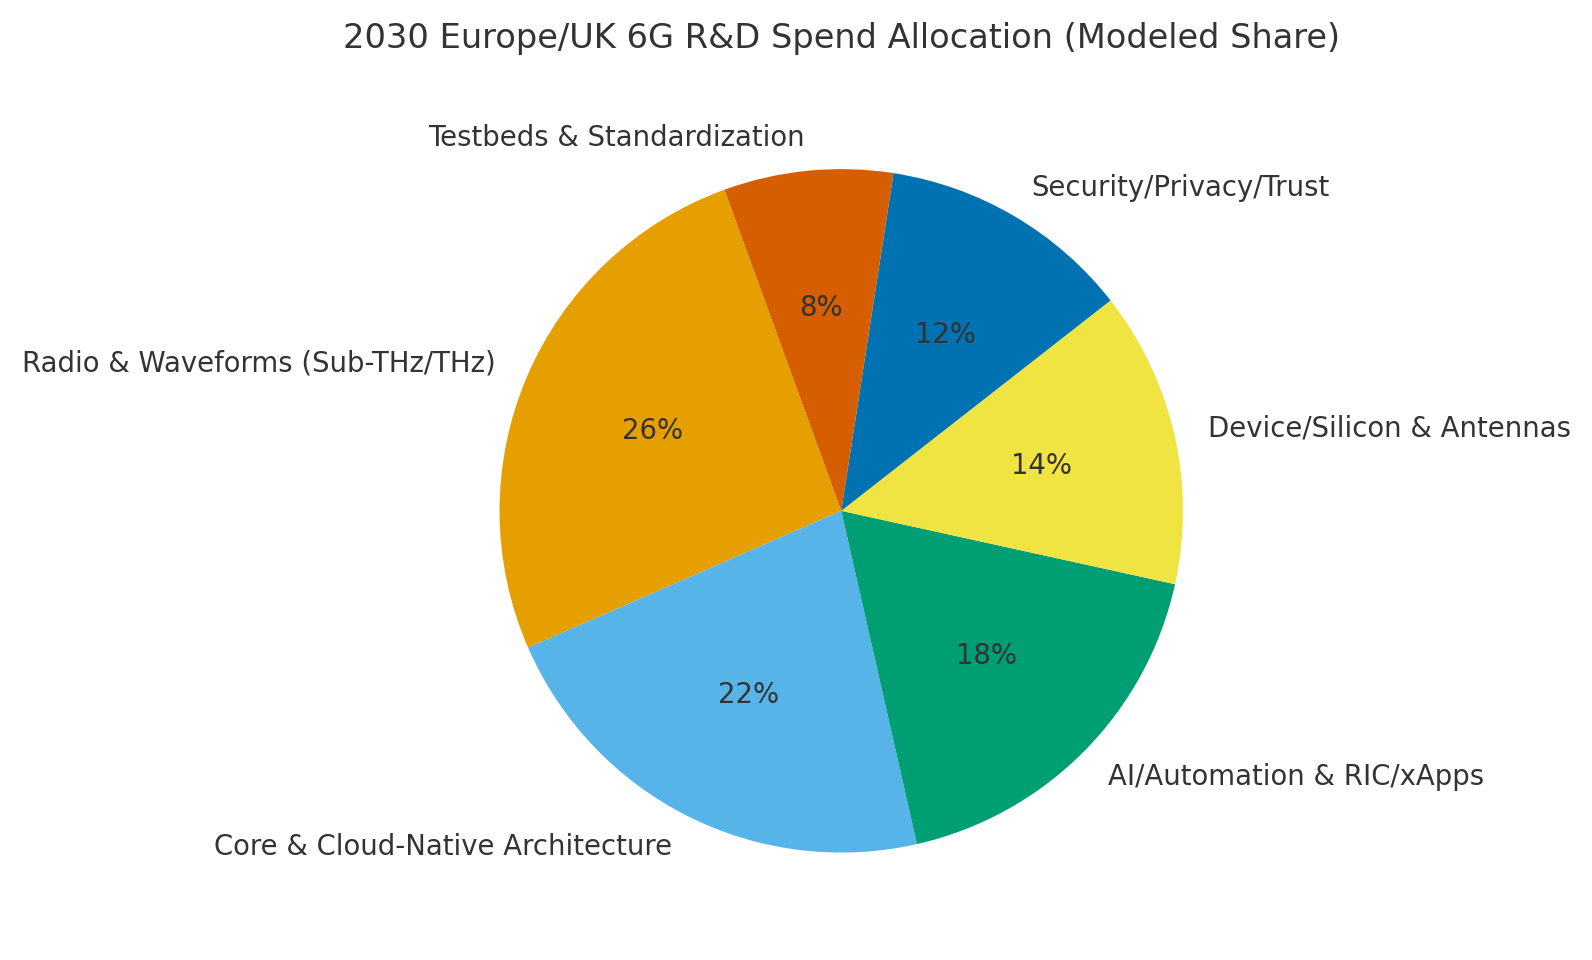
By 2030, we model Europe/UK 6G R&D allocation across categories as Radio & Waveforms (~26%), Core & Cloud‑Native (~22%), AI/Automation (~18%), Device/Silicon (~14%), Security/Privacy (~12%), and Testbeds/Standardization (~8%). The pie figure reflects the mix. UK programs emphasize open RAN and security, Nordics lean into radio/silicon, Germany invests in industrial 6G, and Southern Europe accelerates testbeds via university hubs. Execution priorities: spectrum trials, interop events, and skills pipelines with cross‑border labs.
f) Competitive Landscape
Competition spans operators, OEMs, silicon vendors, hyperscalers, and research alliances. Differentiation vectors: (1) TRL acceleration with portable modules, (2) interop track record across testbeds, (3) spectrum pilots and regulatory alignment, (4) IP quality and FRAND posture, and (5) zero‑trust & energy efficiency baked into designs. Procurement guidance: require evidence of interop pass rates, prototype cycle‑time metrics, publication/IP footprint, and spectrum trial results. Competitive KPIs: TRL, interop %, TTP months, patent momentum, spectrum readiness, and IRR.
Report Details
Proceed To Buy
Want a More Customized Experience?
- Request a Customized Transcript: Submit your own questions or specify changes. We’ll conduct a new call with the industry expert, covering both the original and your additional questions. You’ll receive an updated report for a small fee over the standard price.
- Request a Direct Call with the Expert: If you prefer a live conversation, we can facilitate a call between you and the expert. After the call, you’ll get the full recording, a verbatim transcript, and continued platform access to query the content and more.
68 Circular Road, #02-01 049422, Singapore
Revenue Tower, Scbd, Jakarta 12190, Indonesia
4th Floor, Pinnacle Business Park, Andheri East, Mumbai, 400093
Cinnabar Hills, Embassy Golf Links Business Park, Bengaluru, Karnataka 560071
Request Custom Transcript
Related Transcripts


68 Circular Road, #02-01 049422, Singapore
Revenue Tower, Scbd, No.52-53, Jakarta 12190, Indonesia
Cinnabar Hills, Embassy Golf Links Business Park, Bengaluru, Karnataka 560071
4th Floor, Pinnacle Business Park, Andheri East, Mumbai, 400093


68 Circular Road, #02-01 049422, Singapore
Revenue Tower, Scbd, Jakarta 12190, Indonesia
4th Floor, Pinnacle Business Park, Andheri East, Mumbai, 400093
Cinnabar Hills, Embassy Golf Links Business Park, Bengaluru, Karnataka 560071