

68 Circular Road, #02-01 049422, Singapore
Revenue Tower, Scbd, Jakarta 12190, Indonesia
4th Floor, Pinnacle Business Park, Andheri East, Mumbai, 400093
Cinnabar Hills, Embassy Golf Links Business Park, Bengaluru, Karnataka 560071


Connect With Us


68 Circular Road, #02-01 049422, Singapore
Revenue Tower, Scbd, Jakarta 12190, Indonesia
4th Floor, Pinnacle Business Park, Andheri East, Mumbai, 400093
Cinnabar Hills, Embassy Golf Links Business Park, Bengaluru, Karnataka 560071
Connect With Us
68 Circular Road, #02-01 049422, Singapore
Revenue Tower, Scbd, Jakarta 12190, Indonesia
4th Floor, Pinnacle Business Park, Andheri East, Mumbai, 400093
Cinnabar Hills, Embassy Golf Links Business Park, Bengaluru, Karnataka 560071
Request Custom Transcript
5G-Enabled Autonomous Vehicles: Cloud Infrastructure Requirements & Safety Standards
Autonomous vehicles (AVs) are evolving into cloud-connected robots reliant on low-latency networks, deterministic compute, and safety compliance. EU/UK edge-and-cloud investment for AV operations is projected to grow from ~$2.2B to ~$7.5B by 2030. 5G networks will provide predictable latency and backhaul for key AV functions. Key benefits include reduced latency, improved platform uptime, higher success rates for remote operations, and fewer safety incidents. Pricing includes tele-assist fees, per-vehicle subscriptions for HD maps, and V2X data APIs. Risks include edge under-utilization and regulatory differences, mitigated by corridor-first rollouts and unified compliance standards. 5G-enabled AVs promise safer, more reliable mobility.
What's Covered?
Report Summary
Key Takeaways
1. Corridor‑first deployments de‑risk utilization and SLA design.
2. Metro edge + QoS APIs reduce tail latency and handover failures.
3. Hybrid on‑device planning with cloud assist keeps P2A under 100ms.
4. Tele‑assist needs dual connectivity, priority slices, and audit trails.
5. HD map freshness is a subscription service with local cache rules.
6. Safety is a data problem: standardized logs, scenarios, and KPIs.
7. Security: signed OTA, SBOMs, and zero‑trust for fleet ops.
8. CFO dashboard: latency, uptime, P2A ms, remote‑assist %, incident rate, cert lead time.

a) Market Size & Share
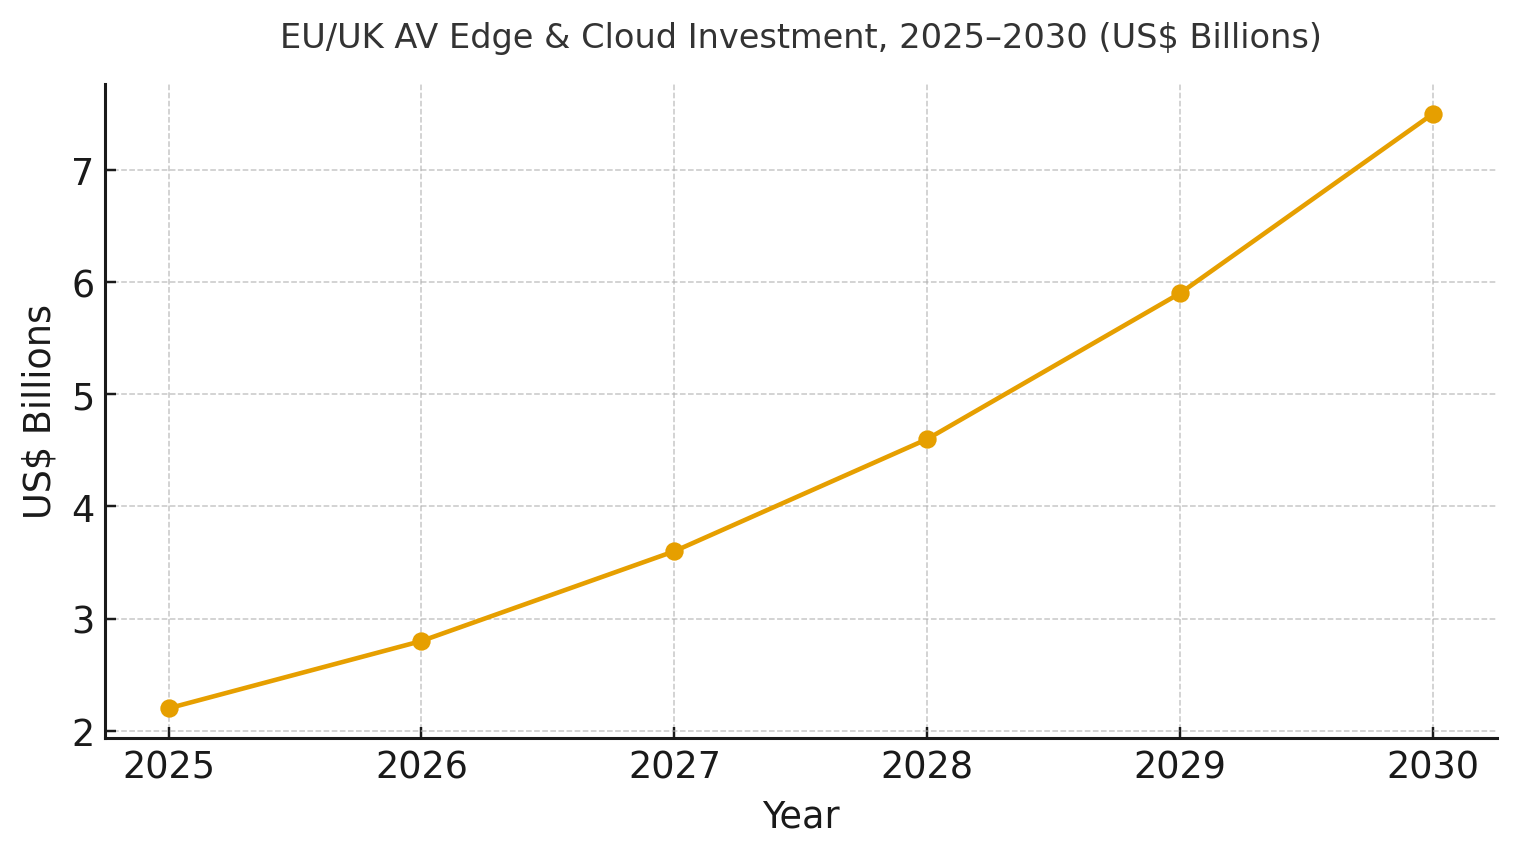
EU/UK AV edge and cloud spend is modeled to grow from ~US$2.2B in 2025 to ~US$7.5B by 2030 as pilots expand into operational corridors. Investments concentrate on metro edge sites, network exposure APIs, and safety/compliance data planes. Share accrues to operators and platforms that combine low‑latency coverage with developer ecosystems and standardized audit logs. The line figure shows the investment trajectory.
Stack share: network and edge infrastructure, remote‑assist control rooms, HD map services, model training/continual learning, V2X data exchanges, and compliance storage. Execution risks include under‑utilized edge capacity, handover edge cases, and fragmented regulation. Mitigations: corridor‑first rollouts, dual connectivity, and compliance artifacts aligned to UNECE and UK frameworks. Track share via revenue by workload, tele‑assist minutes, developer/API adoption, and certified ODD expansions.
b) Market Analysis
Performance and safety economics improve together when edge coverage and orchestration mature. We model E2E 95p latency falling from ~35ms to ~12ms, uptime approaching ~99.95%, perception‑to‑action latency compressing from ~180ms to ~90ms, remote‑ops success rising from ~70% to ~90%, safety incidents dropping from ~6.2 to ~1.8 per million km, and certification timelines declining from ~14 to ~8 months by 2030. Enablers: metro edges, QoS/slicing APIs, hardware acceleration, dual connectivity, and standardized evidence pipelines. Barriers: tunnel/underpass handover, backhaul congestion at events, and regulatory divergence.
Financial lens: attribute revenue from tele‑assist minutes, HD map subscriptions, and V2X data; quantify avoided downtime and insurance savings from incident reduction; and net against edge capex/opex and compliance costs. The bar chart summarizes directional KPI movement under disciplined programs.

c) Trends & Insights
1) Tele‑assist becomes a standard safety valve; pricing converges on per‑minute with SLAs. 2) Hybrid planning keeps critical loops on‑device while offloading non‑urgent perception to edge. 3) HD maps evolve to ‘live localization’ subscriptions with freshness SLAs. 4) V2X APIs standardize for intersection priority and hazard alerts. 5) Evidence pipelines—hash‑chained logs, scenario libraries—speed certification. 6) Security hardens: signed OTA, SBOMs, and zero‑trust fleet ops. 7) Developer ecosystems form around exposure APIs and synthetic data. 8) Cross‑border roaming and data residency rules shape architecture. 9) Digital twins simulate corridors for safety cases. 10) Insurers price risk on incident KPIs and audit quality.
d) Segment Analysis
Robotaxi & Shuttle: corridor operations with tele‑assist backstops; monetize uptime and safety SLAs. Logistics & Last‑Mile: depot‑to‑curb autonomy; priority on reliability and remote recovery. Public Transport: AV shuttles on campuses and BRT lanes; integrate with ticketing and operations. OEM ADAS Subscriptions: stepwise autonomy features with map and perception updates. Municipal Infrastructure: V2X, signal priority, and safety analytics. Across segments, define ODD, SLAs, pricing, and evidence artifacts; track latency, uptime, P2A ms, remote‑assist %, incident rate, and certification timelines.
e) Geography Analysis
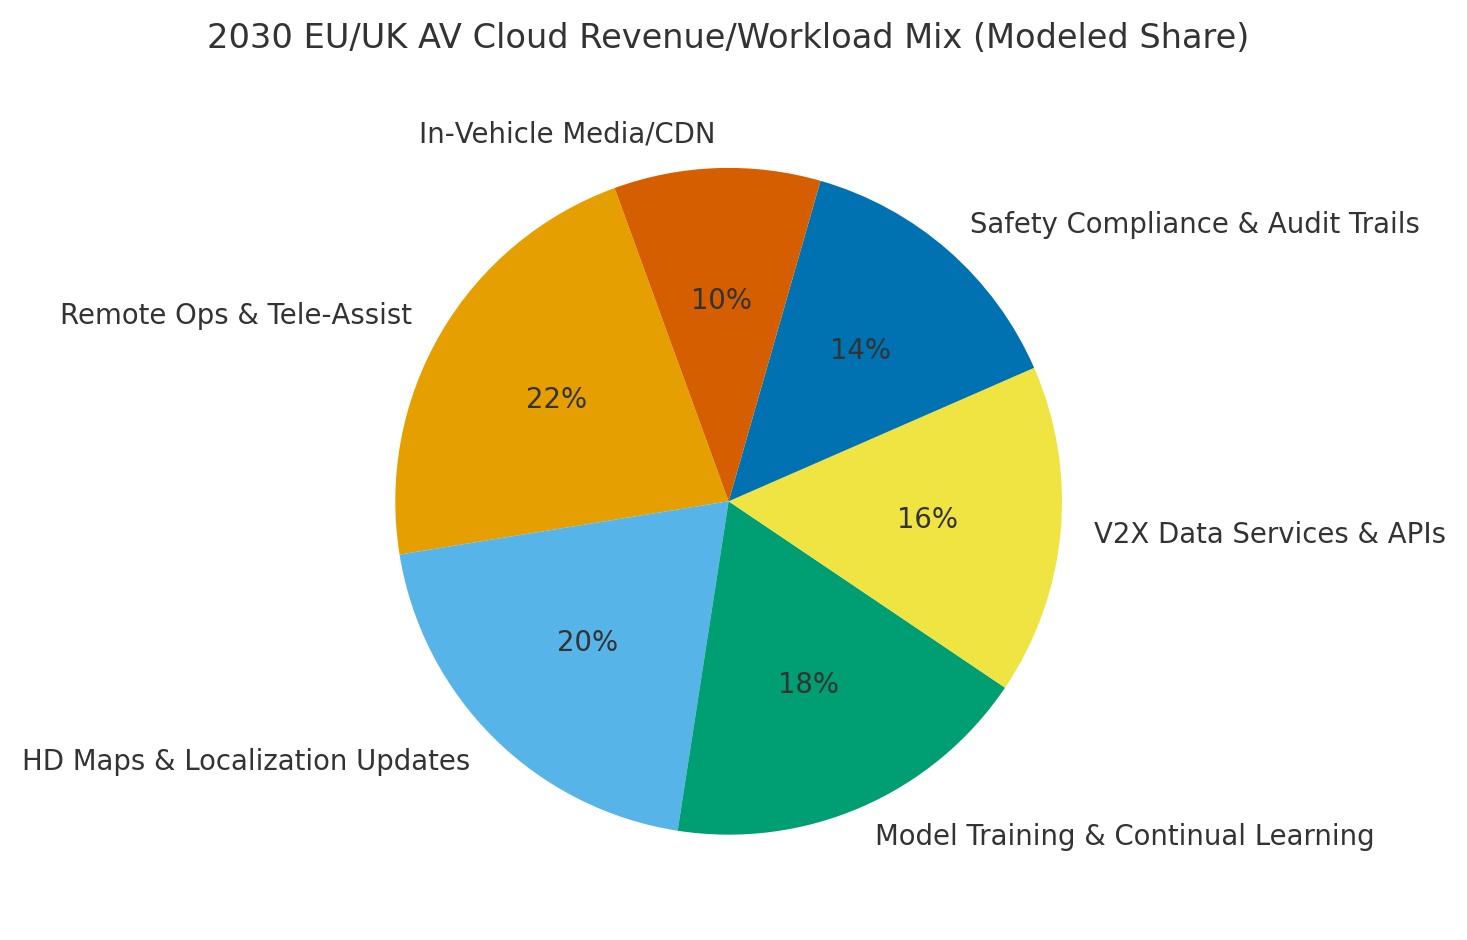
By 2030, we model EU/UK AV cloud revenue/workload mix as Remote Ops & Tele‑Assist (~22%), HD Maps & Localization Updates (~20%), Model Training & Continual Learning (~18%), V2X Data Services & APIs (~16%), Safety Compliance & Audit Trails (~14%), and In‑Vehicle Media/CDN (~10%). London and Manchester corridors lead early in the UK; Paris, Munich, and Nordic metros scale in the EU with strong 5G coverage and city partnerships. The pie figure reflects the modeled mix.
Execution: phase corridors by fiber depth and partner readiness; harmonize compliance artifacts to satisfy UNECE and UK rules; and run roaming tests. Measure region‑specific latency, uptime, remote‑assist %, incident rates, and certification pace; rebalance capex and corridor focus quarterly.
f) Competitive Landscape
Operators, hyperscalers, OEMs, and AV platforms compete to own the AV control plane and data plane. Differentiation vectors: (1) metro edge footprint and tail‑latency control, (2) tele‑assist reliability and operator centers, (3) HD map freshness and coverage, (4) V2X API quality and partnerships with cities, and (5) compliance pipelines and audit tooling. Procurement guidance: require SLA‑backed latency/uptime, API parity across regions, evidence artifacts compatible with UNECE/UK processes, and secure OTA/SBOM enforcement. Competitive KPIs: latency, uptime, P2A ms, remote‑assist %, incident rate, certification lead time, and developer adoption
Report Details
Proceed To Buy
Want a More Customized Experience?
- Request a Customized Transcript: Submit your own questions or specify changes. We’ll conduct a new call with the industry expert, covering both the original and your additional questions. You’ll receive an updated report for a small fee over the standard price.
- Request a Direct Call with the Expert: If you prefer a live conversation, we can facilitate a call between you and the expert. After the call, you’ll get the full recording, a verbatim transcript, and continued platform access to query the content and more.
68 Circular Road, #02-01 049422, Singapore
Revenue Tower, Scbd, Jakarta 12190, Indonesia
4th Floor, Pinnacle Business Park, Andheri East, Mumbai, 400093
Cinnabar Hills, Embassy Golf Links Business Park, Bengaluru, Karnataka 560071
Request Custom Transcript
Related Transcripts
$ 1350

68 Circular Road, #02-01 049422, Singapore
Revenue Tower, Scbd, No.52-53, Jakarta 12190, Indonesia
Cinnabar Hills, Embassy Golf Links Business Park, Bengaluru, Karnataka 560071
4th Floor, Pinnacle Business Park, Andheri East, Mumbai, 400093


68 Circular Road, #02-01 049422, Singapore
Revenue Tower, Scbd, Jakarta 12190, Indonesia
4th Floor, Pinnacle Business Park, Andheri East, Mumbai, 400093
Cinnabar Hills, Embassy Golf Links Business Park, Bengaluru, Karnataka 560071