

68 Circular Road, #02-01 049422, Singapore
Revenue Tower, Scbd, Jakarta 12190, Indonesia
4th Floor, Pinnacle Business Park, Andheri East, Mumbai, 400093
Cinnabar Hills, Embassy Golf Links Business Park, Bengaluru, Karnataka 560071


Connect With Us


68 Circular Road, #02-01 049422, Singapore
Revenue Tower, Scbd, Jakarta 12190, Indonesia
4th Floor, Pinnacle Business Park, Andheri East, Mumbai, 400093
Cinnabar Hills, Embassy Golf Links Business Park, Bengaluru, Karnataka 560071
Connect With Us
68 Circular Road, #02-01 049422, Singapore
Revenue Tower, Scbd, Jakarta 12190, Indonesia
4th Floor, Pinnacle Business Park, Andheri East, Mumbai, 400093
Cinnabar Hills, Embassy Golf Links Business Park, Bengaluru, Karnataka 560071
Request Custom Transcript
Wind Turbine Blade Recycling: Mechanical vs Chemical Processing Economics
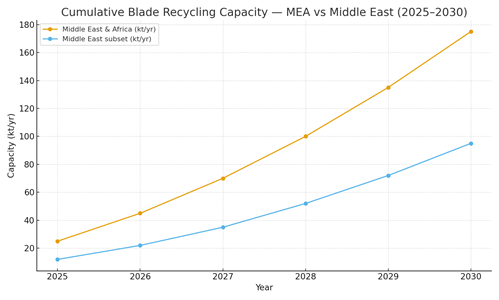
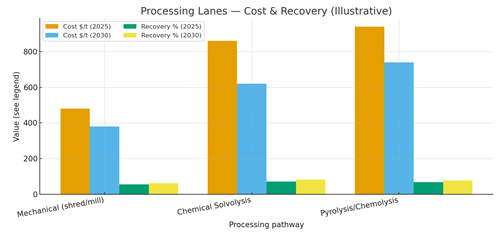
From 2025 to 2030, MEA blade end‑of‑life (EoL) moves from ad‑hoc landfill/stockpiling to regional hubs that combine mechanical pre‑processing with chemical upcycling. Wind additions in North Africa (Morocco, Egypt), South Africa, and the Middle East (Saudi Arabia, UAE) create blade cohorts that age into refurbishment or recycling windows. Developers, OEMs, and waste managers converge on two playbooks: (1) low‑capex mechanical shredding/milling to produce fillers for cement, asphalt, and engineered wood; and (2) chemical routes solvolysis and pyrolysis/chemolysis that recover higher‑value glass/carbon fibers and organics suitable for composites and resin streams. Illustratively, MEA’s dedicated blade‑recycling capacity rises from ~25 kt/yr in 2025 to ~175 kt/yr by 2030, with Middle Eastern hubs growing from ~12 to ~95 kt/yr. Mechanical routes drop from ~$480/t to ~$380/t with line speed gains and cement co‑processing partnerships; chemical routes scale from ~$860–940/t toward ~$620–740/t as solvent recovery, thermal integration, and catalyst lifetimes improve. Recovery rates climb from ~55% (mechanical) and ~68–72% (chemical) to ~62% and ~78–82% respectively by 2030. Logistics, EPR‑style policy signals, and supply‑chain localization determine which hubs capture volume.
What's Covered?
Report Summary
Key Takeaways
1) Mechanical routes win early on capex and logistics; chemical routes win on value and circularity by 2030.
2) Cement and asphalt markets absorb bulk mechanical output; secondary fibers need certification to scale.
3) Solvent recovery, heat integration, and catalysts drive chemical cost declines and quality consistency.
4) EPR‑style policy and landfill restrictions tilt project finance toward recycling hubs.
5) Blade logistics (cut‑and‑ship, port access) are decisive for MEA geography and cost per tonne.
6) Standard contracts specify recovery %, contaminants, and LCA; payments index to verified outcomes.
7) Hybrid plants (mechanical pre‑processing + chemical lines) hedge feed variability and offtake risk.
8) Workforce upskilling in composites QA and plant O&M underpins reliability and yields.
Key Metrics

Market Size & Share
Blade EoL volumes in MEA rise as utility‑scale wind fleets expand and early installations age into repowering. In this illustrative view, dedicated recycling capacity climbs from ~25 kt/yr in 2025 to ~175 kt/yr by 2030, with Middle Eastern hubs (UAE, Saudi Arabia, Oman, Turkey) growing from ~12 to ~95 kt/yr on the back of port logistics and industrial park siting. Africa’s capacity scales in Morocco, Egypt, and South Africa where wind build‑out, cement markets, and export ports align. Market share initially favors mechanical pre‑processing because of lower capex and fast commissioning, especially where cement kilns can absorb glass‑fiber fillers and resin‑rich fuel fractions. As chemical lines mature, share shifts toward solvolysis and pyrolysis/chemolysis that produce higher‑value outputs recovered fibers and resin monomers/oligomers suited for automotive, construction, and renewables components. Share is ultimately won by hubs that pair reliable logistics (cutting, drayage, and backhaul), bankable offtakes with quality specs, and certified environmental performance. Integrated players that operate mechanical front‑ends feeding chemical upcycling gain margin and resilience by flexing to feed variability and demand swings. By 2030, we expect competing portfolios cement‑centric mechanical hubs vs hybrid mechanical‑chemical parks to coexist, with chemical routes capturing a rising share where standards and buyers reward circular content.
Market Analysis
Mechanical processing (segmentation, shredding, milling) delivers the lowest $/t but yields lower‑value outputs granulates for cement/asphalt/engineered wood at recovery rates of ~55–62% by 2030 in this outlook. Chemical routes solvolysis and pyrolysis/chemolysis cost more but recover higher‑value fractions: glass/carbon fibers and organics suitable for composite compounds or monomer streams, lifting recovery to ~78–82% by 2030. Cost declines track solvent recovery loops, heat integration, catalyst life, and plant scale. Energy use (kWh/t) falls as waste heat is reused and line speeds rise; emissions are managed with thermal oxidizers/scrubbers and solvent containment. Economics hinge on logistics, offtakes, and policy. Cement co‑processing offers volume certainty for mechanical routes where kiln markets are deep; chemical plants require steadier quality and QC to win in automotive and building products. EPR and landfill restrictions improve bankability by creating stable feedstock and pricing signals. Contracts migrate to outcome‑based terms: minimum recovery %, contaminant thresholds, and verified LCA benefits. Hybrid plants (mechanical pre‑processing feeding chemical lines) hedge risk, balancing throughput with value capture.
Trends & Insights (2025–2030)
• Hybrid plants pair mechanical front‑ends with chemical upcycling to flex across feed variability and demand.
• Logistics optimization (onsite cutting, modular transport frames, port‑adjacent hubs) reduces $/t dramatically.
• Quality and certification regimes emerge for secondary fibers/resins, enabling higher‑value offtakes.
• Solvent recovery, heat integration, and catalyst management are the levers for chemical unit economics.
• Cement partnerships formalize with indexed pricing for fillers/fuels and emissions accounting for LCA claims.
• Digital MRV platforms tie recovery %, contaminants, and LCA to contracts and EPR reporting.
• Workforce upskilling in composites handling, QA/QC, and plant O&M improves yields and safety.
• Policy: landfill restrictions, EPR fees/credits, and procurement pref for circular content shape markets.
Segment Analysis
• Mechanical hubs near cement clusters: prioritize shred/mill lines, dust control, and kiln offtake contracts.
• Chemical upcycling parks in industrial zones: design for solvent recovery, heat integration, and strict QA.
• Hybrid facilities at ports/SEZs: import/export flexibility; balance throughput (mechanical) with value (chemical).
• OEM/developer take‑back programs: centralize volumes; standardize cutting and transport; enable EPR compliance.
Buyer guidance: map blade cohorts and logistics; choose lane mix by offtake value and policy; set outcome‑based KPIs (recovery %, cost $/t, energy kWh/t, contaminant ppm); and deploy MRV and certifications to substantiate circular claims.
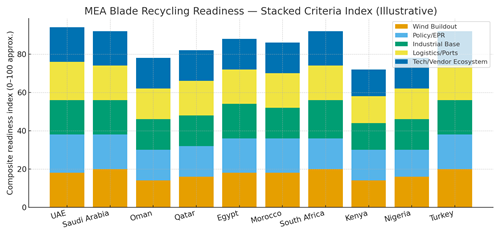
Geography Analysis (Middle East & Africa)
Readiness concentrates in GCC ports (UAE, Saudi Arabia, Oman, Qatar) with free zones, petrochemical utilities, and export logistics; North Africa (Morocco, Egypt) leverages wind build‑out and cement markets; South Africa anchors a southern hub with industrial base and ports; Kenya and Nigeria advance selectively with regional logistics and policy progress; Turkey connects MEA flows to European buyers. The stacked criteria wind buildout, EPR/policy, industrial base, logistics/ports, and tech/vendor ecosystem indicate where balanced capabilities convert blade volumes into bankable recycling portfolios.
Implications: stage hybrid hubs at ports and cement corridors; codify offtake specs; integrate MRV; and harmonize contracts across countries to enable competition and finance.
Competitive Landscape (Ecosystem & Delivery Models)
Competition spans mechanical shred/mill OEMs, chemical upcycling licensors (solvolysis, pyrolysis/chemolysis), cement partners, logistics providers, MRV platforms, and EPR program operators. Differentiators: delivered cost $/t including logistics, verified recovery %, product quality/certifications, and emissions/LCA reporting. Integrated developers that lock feedstock contracts, operate hybrid mechanical‑chemical plants, and sign multi‑year offtakes with cement and composites buyers will lead. Delivery models shift to outcome‑based contracts indexed to recovery %, contaminants, and MRV‑verified LCA, with step‑down pricing as volumes and learning improve. Finance favors port‑adjacent hubs with diversified offtakes and standardized QA; insurers back plants with robust HSE and solvent management. By 2030, MEA will feature several regional clusters competing on logistics, quality, and circular credentials.
Report Details
Proceed To Buy
Want a More Customized Experience?
- Request a Customized Transcript: Submit your own questions or specify changes. We’ll conduct a new call with the industry expert, covering both the original and your additional questions. You’ll receive an updated report for a small fee over the standard price.
- Request a Direct Call with the Expert: If you prefer a live conversation, we can facilitate a call between you and the expert. After the call, you’ll get the full recording, a verbatim transcript, and continued platform access to query the content and more.
68 Circular Road, #02-01 049422, Singapore
Revenue Tower, Scbd, Jakarta 12190, Indonesia
4th Floor, Pinnacle Business Park, Andheri East, Mumbai, 400093
Cinnabar Hills, Embassy Golf Links Business Park, Bengaluru, Karnataka 560071
Request Custom Transcript
Related Transcripts
$ 1445

$ 1345
$ 1432

68 Circular Road, #02-01 049422, Singapore
Revenue Tower, Scbd, No.52-53, Jakarta 12190, Indonesia
Cinnabar Hills, Embassy Golf Links Business Park, Bengaluru, Karnataka 560071
4th Floor, Pinnacle Business Park, Andheri East, Mumbai, 400093


68 Circular Road, #02-01 049422, Singapore
Revenue Tower, Scbd, Jakarta 12190, Indonesia
4th Floor, Pinnacle Business Park, Andheri East, Mumbai, 400093
Cinnabar Hills, Embassy Golf Links Business Park, Bengaluru, Karnataka 560071