

68 Circular Road, #02-01 049422, Singapore
Revenue Tower, Scbd, Jakarta 12190, Indonesia
4th Floor, Pinnacle Business Park, Andheri East, Mumbai, 400093
Cinnabar Hills, Embassy Golf Links Business Park, Bengaluru, Karnataka 560071


Connect With Us


68 Circular Road, #02-01 049422, Singapore
Revenue Tower, Scbd, Jakarta 12190, Indonesia
4th Floor, Pinnacle Business Park, Andheri East, Mumbai, 400093
Cinnabar Hills, Embassy Golf Links Business Park, Bengaluru, Karnataka 560071
Connect With Us
68 Circular Road, #02-01 049422, Singapore
Revenue Tower, Scbd, Jakarta 12190, Indonesia
4th Floor, Pinnacle Business Park, Andheri East, Mumbai, 400093
Cinnabar Hills, Embassy Golf Links Business Park, Bengaluru, Karnataka 560071
Request Custom Transcript
Sustainable Retail Packaging in EU: Cost Impact, Recycling Mandates & Shopper Preferences (2025–2030)
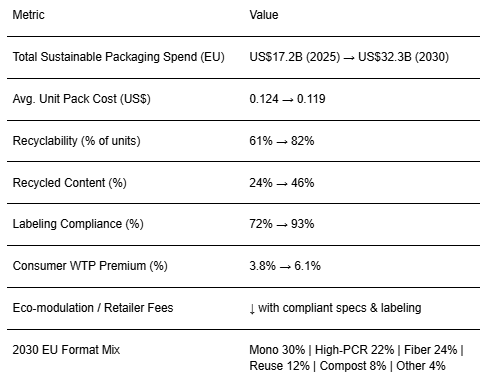
EU retail packaging is entering a mandate‑driven redesign cycle. Between 2025 and 2030, brands migrate to simpler, recyclable formats with higher recycled content while piloting reuse/refill systems where density and habit exist. We model total EU spend on sustainable retail packaging design changes, material premiums, and compliance growing from ~US$17.2B (2025) to ~US$32.3B (2030). Contrary to popular belief, unit costs do not necessarily rise: as designs standardize on mono‑material families and right‑sizing reduces dimensional weight, average unit pack cost edges down from ~US$0.124 to ~US$0.119 by 2030. Mandates set the floor; shopper preference sets the ceiling. Policy pressure accelerates recyclability and labeling compliance, while consumers increasingly reward proof‑based claims clear icons, QR verification, and third‑party audits lifting willingness‑to‑pay (WTP) premiums from ~3.8% to ~6.1% on eligible categories. Our model suggests EU median brands can raise the share of recyclable packs from ~61% to ~82% and recycled content from ~24% to ~46% by 2030, while pushing labeling compliance from ~72% to ~93%. Reuse/refill scales in urban corridors and closed‑loop channels (beauty, home care, beverages), supported by deposits and durable packaging.

What's Covered?
Report Summary
Key Takeaways
1. Mandates accelerate recyclability and labeling; fees reward compliant specs.
2. Mono‑material designs + right‑sizing hold unit costs flat/down by 2030.
3. PCR and fiber multi‑sourcing reduces volatility and quality risk.
4. QR/NFC identities enable verified claims, sorting, and recalls.
5. Reuse/refill works where density and deposit economics align.
6. Barrier/coating choices must preserve recyclability streams.
7. Audited claims lift WTP and brand preference; avoid greenwashing.
8. CFO dashboard: unit cost, recyclability %, recycled content %, labeling %, WTP %, and fees avoided.
Key Metrics
Market Size & Share
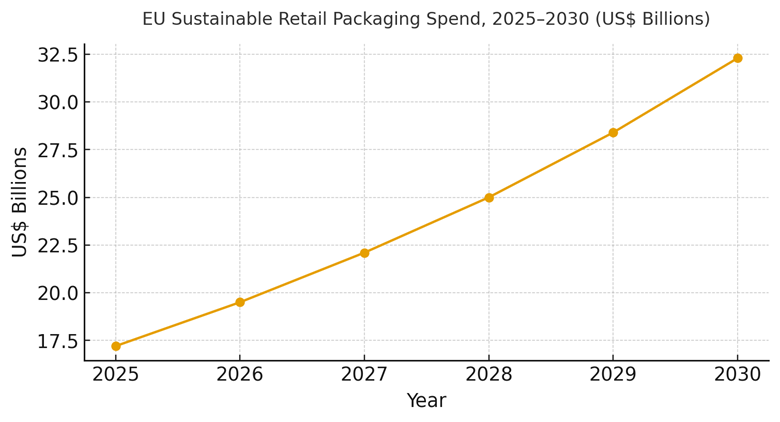
EU sustainable retail packaging spend is modeled to climb from ~US$17.2B in 2025 to ~US$32.3B by 2030 as brands re‑engineer formats to meet recycling mandates and retailer scorecards. Early share growth accrues to converters and brands with standardized mono‑material families and certified PCR/fiber suppliers. The line figure charts the trajectory.
Share within the stack: materials (PCR/fiber), conversion and coatings, identity/serialization, and labeling/compliance. Execution risks: PCR volatility, barrier compatibility with recycling streams, and line changeover constraints. Mitigations: contract buffers, migration testing, and spec libraries. Share should be tracked via recyclability %, recycled content %, unit cost, and compliance fee trends by market and category.
Market Analysis
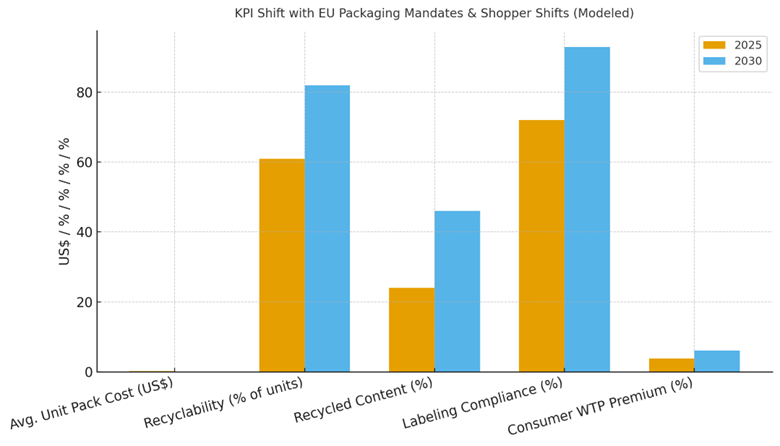
Mandates and shopper preferences jointly shift economics. We model recyclability rising from ~61% to ~82% of units, recycled content from ~24% to ~46%, labeling compliance from ~72% to ~93%, and consumer WTP premium from ~3.8% to ~6.1% by 2030. Average unit pack cost trends down from ~US$0.124 to ~US$0.119 as designs simplify and DIM weight falls, partially offsetting material premiums. Enablers: spec libraries, multi‑sourced PCR/fiber, QR/NFC identities, and clear claims. Barriers: barrier trade‑offs, supply volatility, and capex for line conversions.
Financial lens: measure contribution margin gains from damage reduction, reverse‑logistics savings, and eco‑fee avoidance; attribute price realization from preference lift and WTP; and net against incremental material and capital costs. The bar chart summarizes directional KPI movement under disciplined programs.
Trends & Insights
1) Design‑for‑recyclability becomes default mono‑PE/PP, clear PET, fiber trays minimizing inks/adhesives. 2) On‑pack digital IDs (QR/NFC) verify claims, aid sorting, and enable recalls and loyalty. 3) PCR markets scale with quality controls and long‑term contracts; food‑grade streams expand. 4) Reuse/refill expands in dense urban channels where deposit economics work. 5) Eco‑modulation and retailer scorecards converge on harmonized labels. 6) Security inks and tamper features grow in premium segments. 7) Life‑cycle labels and third‑party audits curb greenwashing. 8) Automation‑friendly specs reduce downtime. 9) Light weighting and right‑sizing cut emissions and transport cost. 10) Shopper narratives shift from generic ‘eco’ to proof‑based performance and convenience.
Segment Analysis
Food & Beverage: Mono‑material films, clear PET; freshness coatings tuned for recyclability. Beauty & Personal Care: High‑PCR rigid packs, refill pods, security inks. Home Care: Concentrates and lightweight pouches; child‑safe closures. OTC/Pharma‑adjacent: Serialization and tamper evidence; barrier‑sensitive choices. Premium Gifting: Fiber‑first and reusable formats. Across segments, define barrier needs, identity features, and return/refill mechanics; track unit cost, recyclability %, recycled content %, labeling %, and preference/WTP by segment.
Geography Analysis
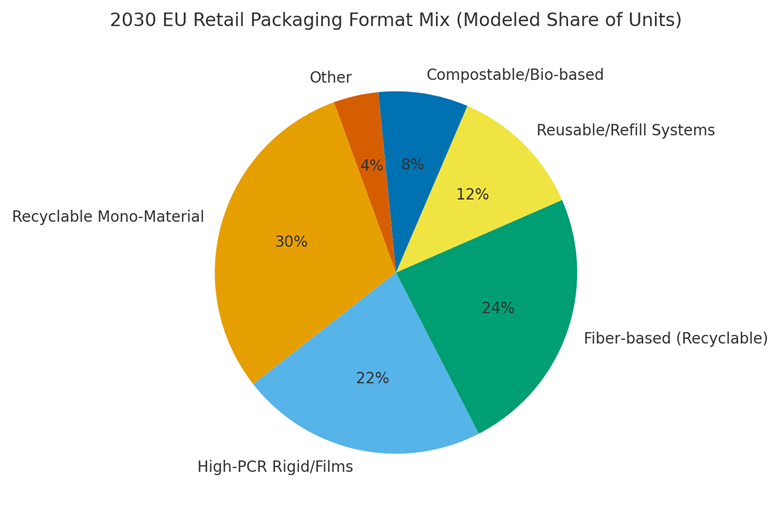
By 2030, EU packaging format mix is modeled as Recyclable Mono‑Material (~30%), High‑PCR Rigid/Films (~22%), Fiber‑based (~24%), Reusable/Refill (~12%), Compostable/Bio‑based (~8%), and Other (~4%). Northern and Western Europe scale mono/fiber fastest; Southern corridors adopt compostables where infrastructure supports it; dense metros lead reuse/refill. The pie figure reflects the mix.
Execution: align specs with country labeling and EPR rules; stage pilots in dense urban regions; and scale with multi‑sourced PCR/fiber. Measure region‑specific recyclability %, recycled content %, unit cost, and preference lift; rebalance budgets quarterly.
Competitive Landscape
Converters, resin/fiber suppliers, identity/serialization vendors, and labelers compete to equip brands for mandate‑driven change. Differentiation vectors: (1) certified PCR/fiber supply reliability, (2) barrier performance compatible with recycling streams, (3) conversion cost and speed, (4) digital IDs and security features, and (5) audit and compliance support. Procurement guidance: require recycled‑content certificates, migration/compatibility tests, and open spec libraries. Competitive KPIs: unit cost, recyclability %, recycled content %, labeling %, WTP %, eco‑fees avoided, and time‑to‑line.
Report Details
Proceed To Buy
Want a More Customized Experience?
- Request a Customized Transcript: Submit your own questions or specify changes. We’ll conduct a new call with the industry expert, covering both the original and your additional questions. You’ll receive an updated report for a small fee over the standard price.
- Request a Direct Call with the Expert: If you prefer a live conversation, we can facilitate a call between you and the expert. After the call, you’ll get the full recording, a verbatim transcript, and continued platform access to query the content and more.
68 Circular Road, #02-01 049422, Singapore
Revenue Tower, Scbd, Jakarta 12190, Indonesia
4th Floor, Pinnacle Business Park, Andheri East, Mumbai, 400093
Cinnabar Hills, Embassy Golf Links Business Park, Bengaluru, Karnataka 560071
Request Custom Transcript
Related Transcripts


68 Circular Road, #02-01 049422, Singapore
Revenue Tower, Scbd, No.52-53, Jakarta 12190, Indonesia
Cinnabar Hills, Embassy Golf Links Business Park, Bengaluru, Karnataka 560071
4th Floor, Pinnacle Business Park, Andheri East, Mumbai, 400093


68 Circular Road, #02-01 049422, Singapore
Revenue Tower, Scbd, Jakarta 12190, Indonesia
4th Floor, Pinnacle Business Park, Andheri East, Mumbai, 400093
Cinnabar Hills, Embassy Golf Links Business Park, Bengaluru, Karnataka 560071