

68 Circular Road, #02-01 049422, Singapore
Revenue Tower, Scbd, Jakarta 12190, Indonesia
4th Floor, Pinnacle Business Park, Andheri East, Mumbai, 400093
Cinnabar Hills, Embassy Golf Links Business Park, Bengaluru, Karnataka 560071


Connect With Us


68 Circular Road, #02-01 049422, Singapore
Revenue Tower, Scbd, Jakarta 12190, Indonesia
4th Floor, Pinnacle Business Park, Andheri East, Mumbai, 400093
Cinnabar Hills, Embassy Golf Links Business Park, Bengaluru, Karnataka 560071
Connect With Us
68 Circular Road, #02-01 049422, Singapore
Revenue Tower, Scbd, Jakarta 12190, Indonesia
4th Floor, Pinnacle Business Park, Andheri East, Mumbai, 400093
Cinnabar Hills, Embassy Golf Links Business Park, Bengaluru, Karnataka 560071
Request Custom Transcript
Smart Grid Cybersecurity Risk Assessment: Threat Mitigation for Distributed Energy Resources
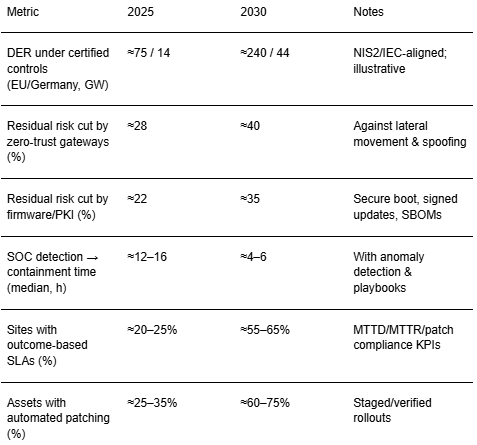
Between 2025 and 2030, Europe’s power systems absorb unprecedented volumes of DER PV, batteries, EVSE, heat pumps, and flexible loads pushing cybersecurity from a compliance checkbox to a reliability imperative. Germany and the Benelux lead standardized approaches that blend NIS2 governance with IEC 62443 and ENTSO‑E cyber‑security controls, while the Nordics operationalize threat intelligence sharing across TSOs/DSOs. The winning posture is layered: zero‑trust device gateways and certificate‑based onboarding; segmented DERMS/SCADA with least‑privilege; secure firmware/PKI for lifecycle trust; and SOC capabilities fused with grid‑aware anomaly detection. Quantitatively, illustrative trajectories suggest DER capacity operating under certified cyber controls rises from ~75 GW in 2025 to ~240 GW in Europe by 2030, with Germany growing from ~14 to ~44 GW. Risk models show residual risk can be cut ~28–40% via zero‑trust gateways and ~22–35% via secure firmware/PKI as TCO improves 20–40% with scale and automation. SOC + anomaly detection (OT + physics‑informed analytics) lifts detection rates and shortens time‑to‑contain, while segmented DERMS/SCADA reduces lateral movement risk.
What's Covered?
Report Summary
Key Takeaways
1) Layered defense wins: zero‑trust gateways + segmented DERMS/SCADA + PKI + SOC analytics.
2) Outcome‑based SLAs (MTTD, MTTR, patch rate, containment) outperform checklist compliance.
3) PKI and signed firmware updates turn device fleets into manageable, attestable assets.
4) Physics‑informed anomaly detection reduces false positives vs IT‑only signatures.
5) Asset inventory, SBOMs, and audit trails unlock insurance and financing on better terms.
6) Nordic/DE/Benelux ecosystems set the pace; Spain/Italy/Poland scale with standardized kits.
7) Tabletop, red‑team, and black‑start drills reveal gaps that paperwork misses.
8) Cyber design must coexist with grid reliability: fail‑secure, safe‑fallback, and islanding rules.
Key Metrics
Market Size & Share
DER penetration accelerates grid digitalization and attack surface growth. In this illustrative outlook, cumulative European DER capacity operating under certified cyber controls rises from ~75 GW (2025) to ~240 GW (2030), with Germany increasing from ~14 to ~44 GW. Adoption concentrates around DSOs and aggregators that standardize device onboarding via gateways with hardware roots of trust and certificate‑based identity. Procurement consolidates toward vendors that bundle secure firmware, PKI management, and DERMS integration reducing total cost of ownership and time‑to‑compliance across multi‑vendor fleets.
Share dynamics favor countries with strong policy and data‑sharing ecosystems. Germany and the Netherlands benefit from clear grid codes and certification bodies; the Nordics lead on operational intelligence and cross‑utility collaboration; France and the UK scale through large‑utility programs; Spain, Italy and Poland ramp with standardized kits and service models. By 2030, a majority of new DER interconnections in leading markets are onboarded through zero‑trust gateways and managed PKI, enabling outcome‑based cyber SLAs.

Market Analysis
Mitigation lanes deliver compounding risk reductions as costs fall with scale and automation. Zero‑trust gateways provide device identity, protocol mediation, and policy enforcement near the edge cutting lateral movement and spoofing risks by ~28–40% in this outlook. Secure firmware/PKI extends lifecycle trust with secure boot, signed updates, and revocation mechanisms delivering ~22–35% risk reduction as certificate automation matures. SOC + anomaly detection fuses OT telemetry and physics models to reduce MTTD/MTTR, while segmented DERMS/SCADA limits blast radius and enables safe‑fallback behavior.
Economics hinge on integration overheads, field service costs, and false positive rates. Cost indices improve 20–40% by 2030 through standardized kits, remote attestation, and automated key management. Outcome‑based SLAs tied to MTTD/MTTR and patch compliance align vendor incentives with measurable resilience. Buyers should stress‑test architectures via red‑team exercises and black‑start drills to validate containment without compromising stability.

Trends & Insights (2025–2030)
• Zero‑trust by default: device identity, least‑privilege, micro‑segmentation from inverter to control center.
• PKI at scale: automated provisioning/rotation; SBOM‑linked firmware updates; remote attestation.
• Physics‑aware detection: fusing SCADA/DERMS data with power‑system models to suppress false alarms.
• NIS2/IEC 62443 alignment: consistent requirements for logging, backups, and incident reporting across DSOs.
• Secure patch orchestration: canary groups, staged rollouts, and verified rollbacks.
• Insurance‑linked KPIs: cyber premiums tied to auditable MTTD/MTTR and patch compliance.
• Data governance: asset inventory, configuration baselines, and audit trails unify IT/OT operations.
• Workforce: OT security analysts and field engineers trained on cert handling and safe‑fallback modes.
Segment Analysis
• Residential/prosumer DER (PV, batteries, EVSE): high fleet scale; emphasize secure onboarding, signed firmware, and anomaly detection leveraging power‑quality data.
• C&I DER and microgrids: require segmented DERMS/SCADA, zero‑trust gateways, and incident drills to preserve operations during containment or islanding.
• Aggregators/VPPs: focus on PKI automation, telemetry normalization, and performance‑linked SLAs with DSOs/TSOs.
• DSOs/TSOs: build SOC capability with OT runbooks, cross‑utility intel sharing, and regulatory‑grade reporting.
Buyer guidance: mandate zero‑trust architectures; require PKI lifecycle management; integrate physics‑aware analytics; and contract outcome SLAs tied to MTTD/MTTR and patch compliance.
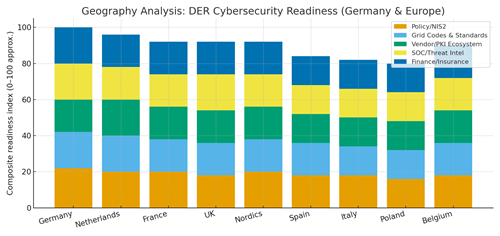
Geography Analysis (Germany & Europe)
Germany and the Netherlands lead on policy clarity, grid codes, and certification bodies; the Nordics excel in operational collaboration and data‑sharing; France and the UK scale programs via large utilities; Spain and Italy expand with standardized kits; Poland and Belgium grow as finance and vendor ecosystems deepen. The stacked criteria policy/NIS2, grid codes/standards, vendor/PKI ecosystem, SOC/threat intelligence, and finance/insurance highlight where to sequence investments and partnerships. Markets with balanced scores execute faster and achieve lower residual risk for a given spend.
Implications: launch portfolios in high‑readiness countries to establish playbooks; export standardized kits and SOC procedures; and harmonize KPIs to enable vendor competition and auditability.
Competitive Landscape (Ecosystem & Delivery Models)
Competition spans zero‑trust gateway vendors, PKI/firmware security providers, SOC/MDR services with OT specialism, DERMS/SCADA integrators, and cyber insurers. Differentiators: automated certificate management, signed firmware and SBOM integration, physics‑aware analytics, and outcome SLAs. Leaders deliver integrated stacks gateway → PKI → SOC → DERMS under contracts indexed to MTTD/MTTR and patch compliance, with audit trails and regulator‑ready reporting. Delivery models shift from project‑based deployments to managed cyber services for DER fleets. Cross‑utility intel sharing and standardized incident drills accelerate learning. Vendors that prove containment without grid instability, and that back it with measurable KPIs, will win Europe’s DER cyber market through 2030.
Report Details
Proceed To Buy
Want a More Customized Experience?
- Request a Customized Transcript: Submit your own questions or specify changes. We’ll conduct a new call with the industry expert, covering both the original and your additional questions. You’ll receive an updated report for a small fee over the standard price.
- Request a Direct Call with the Expert: If you prefer a live conversation, we can facilitate a call between you and the expert. After the call, you’ll get the full recording, a verbatim transcript, and continued platform access to query the content and more.
68 Circular Road, #02-01 049422, Singapore
Revenue Tower, Scbd, Jakarta 12190, Indonesia
4th Floor, Pinnacle Business Park, Andheri East, Mumbai, 400093
Cinnabar Hills, Embassy Golf Links Business Park, Bengaluru, Karnataka 560071
Request Custom Transcript
Related Transcripts

$ 1445

$ 1345
$ 1432

68 Circular Road, #02-01 049422, Singapore
Revenue Tower, Scbd, No.52-53, Jakarta 12190, Indonesia
Cinnabar Hills, Embassy Golf Links Business Park, Bengaluru, Karnataka 560071
4th Floor, Pinnacle Business Park, Andheri East, Mumbai, 400093


68 Circular Road, #02-01 049422, Singapore
Revenue Tower, Scbd, Jakarta 12190, Indonesia
4th Floor, Pinnacle Business Park, Andheri East, Mumbai, 400093
Cinnabar Hills, Embassy Golf Links Business Park, Bengaluru, Karnataka 560071