

68 Circular Road, #02-01 049422, Singapore
Revenue Tower, Scbd, Jakarta 12190, Indonesia
4th Floor, Pinnacle Business Park, Andheri East, Mumbai, 400093
Cinnabar Hills, Embassy Golf Links Business Park, Bengaluru, Karnataka 560071


Connect With Us


68 Circular Road, #02-01 049422, Singapore
Revenue Tower, Scbd, Jakarta 12190, Indonesia
4th Floor, Pinnacle Business Park, Andheri East, Mumbai, 400093
Cinnabar Hills, Embassy Golf Links Business Park, Bengaluru, Karnataka 560071
Connect With Us
68 Circular Road, #02-01 049422, Singapore
Revenue Tower, Scbd, Jakarta 12190, Indonesia
4th Floor, Pinnacle Business Park, Andheri East, Mumbai, 400093
Cinnabar Hills, Embassy Golf Links Business Park, Bengaluru, Karnataka 560071
Request Custom Transcript
Sodium-Ion Battery Breakthrough: Market Opportunity, Cost Structures & Competitive Landscape (2025–2030)
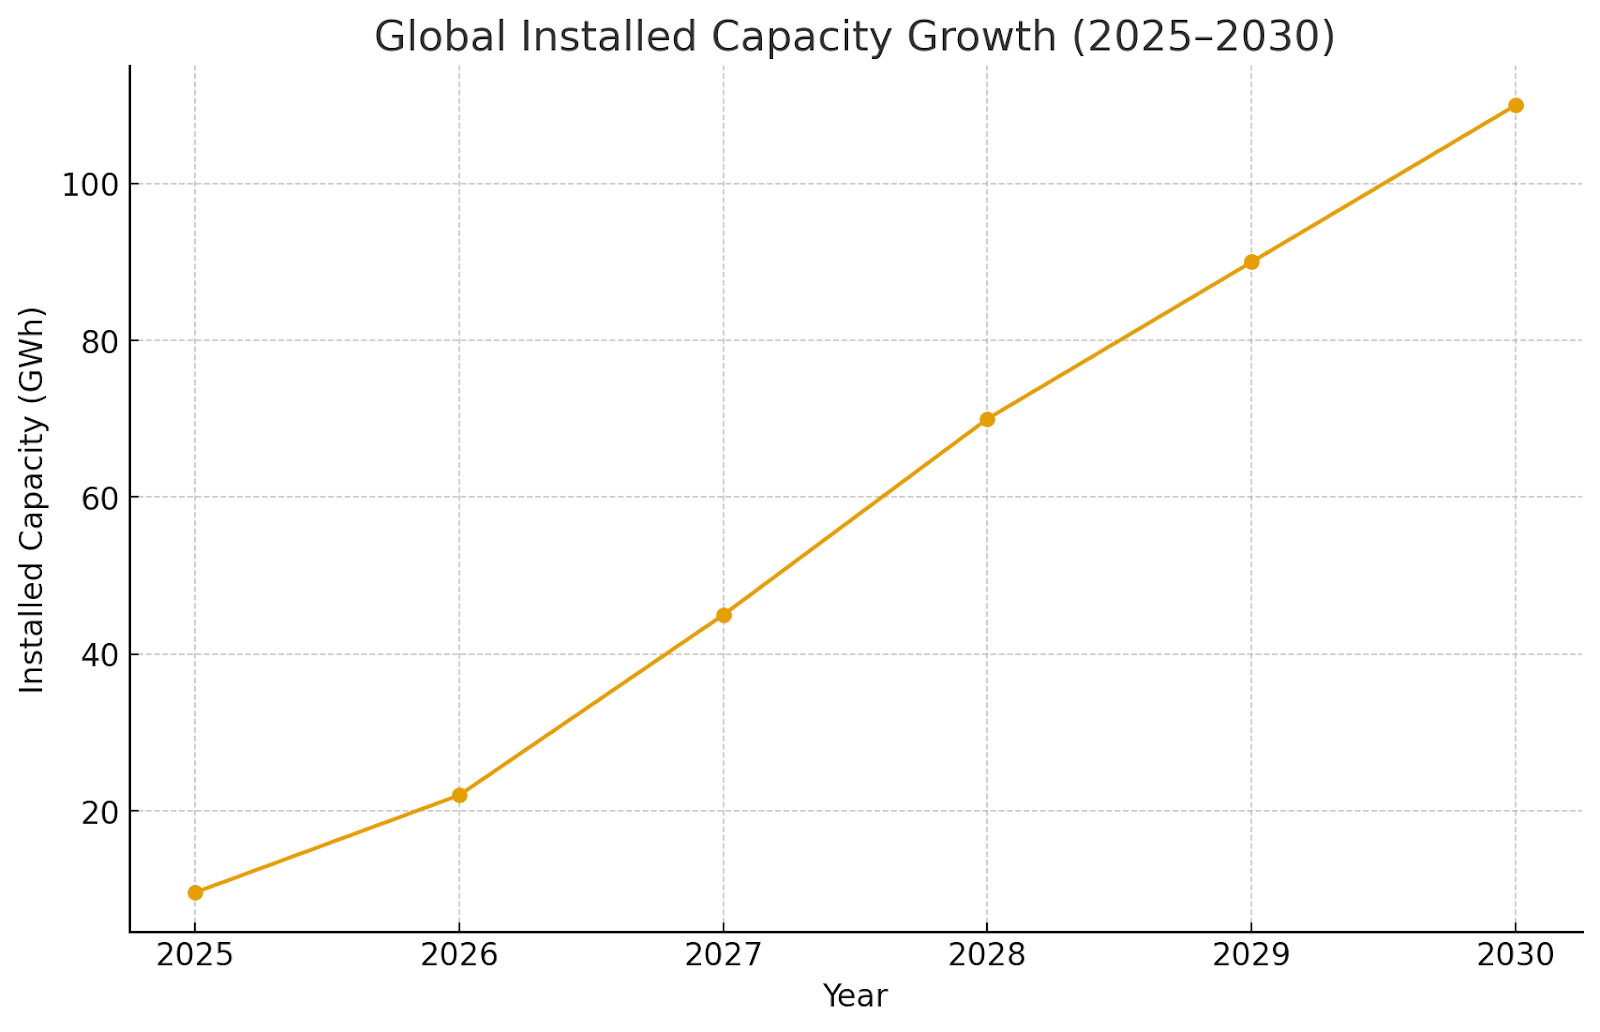
Sodium-ion batteries (Na-ion) are emerging as the next major inflection point in energy storage, offering 20–30% lower material costs versus lithium-ion. Between 2025 and 2030, global installed capacity is expected to surge from under 10 GWh to 110 GWh. Driven by supply diversification, sustainability mandates, and raw material availability, Na-ion technology is poised to reshape cost curves, especially in stationary storage and low-range EV segments.

What's Covered?
Report Summary

Global Adoption Curve (2025–2030)
Sodium-ion batteries are projected to scale from <10 GWh in 2025 to ~110 GWh by 2030, with China accounting for 70% of this capacity. Initial adoption is led by grid-scale and two-wheeler applications. Rapid pilot-to-commercial transitions in 2026–27 are expected as BYD and HiNa Battery deploy large-scale facilities in Jiangsu and Gujarat. Global market penetration reaches ~12–15% by 2030, reflecting sodium’s cost and availability advantages over lithium.
Cost Structure Comparison: Sodium vs Lithium-Ion
Sodium-ion’s key cost advantage lies in raw materials: sodium carbonate at ~$260/ton vs lithium carbonate at $13,000–18,000/ton. Absence of nickel and cobalt further trims pack costs by 15–18%. Manufacturing CAPEX is comparable, but cell assembly requires lower environmental control, reducing facility costs by ~12%. By 2030, Na-ion packs are expected to cost ~$60/kWh compared to lithium-ion’s ~$115/kWh, driving strong substitution potential in cost-sensitive markets.
End-Use Segment Adoption Outlook
Stationary storage (grid and renewables) will represent ~55% of Na-ion demand by 2030, followed by two-wheelers (25%) and light EVs (15%). Consumer electronics remain a minor use case (<5%). Unlike lithium-ion, Na-ion’s moderate energy density (~160 Wh/kg by 2030) restricts long-range EVs but aligns with daily commuter and distributed storage markets. OEMs in India and Southeast Asia are early adopters due to favorable climate compatibility.
Technological Barriers to Scale-Up
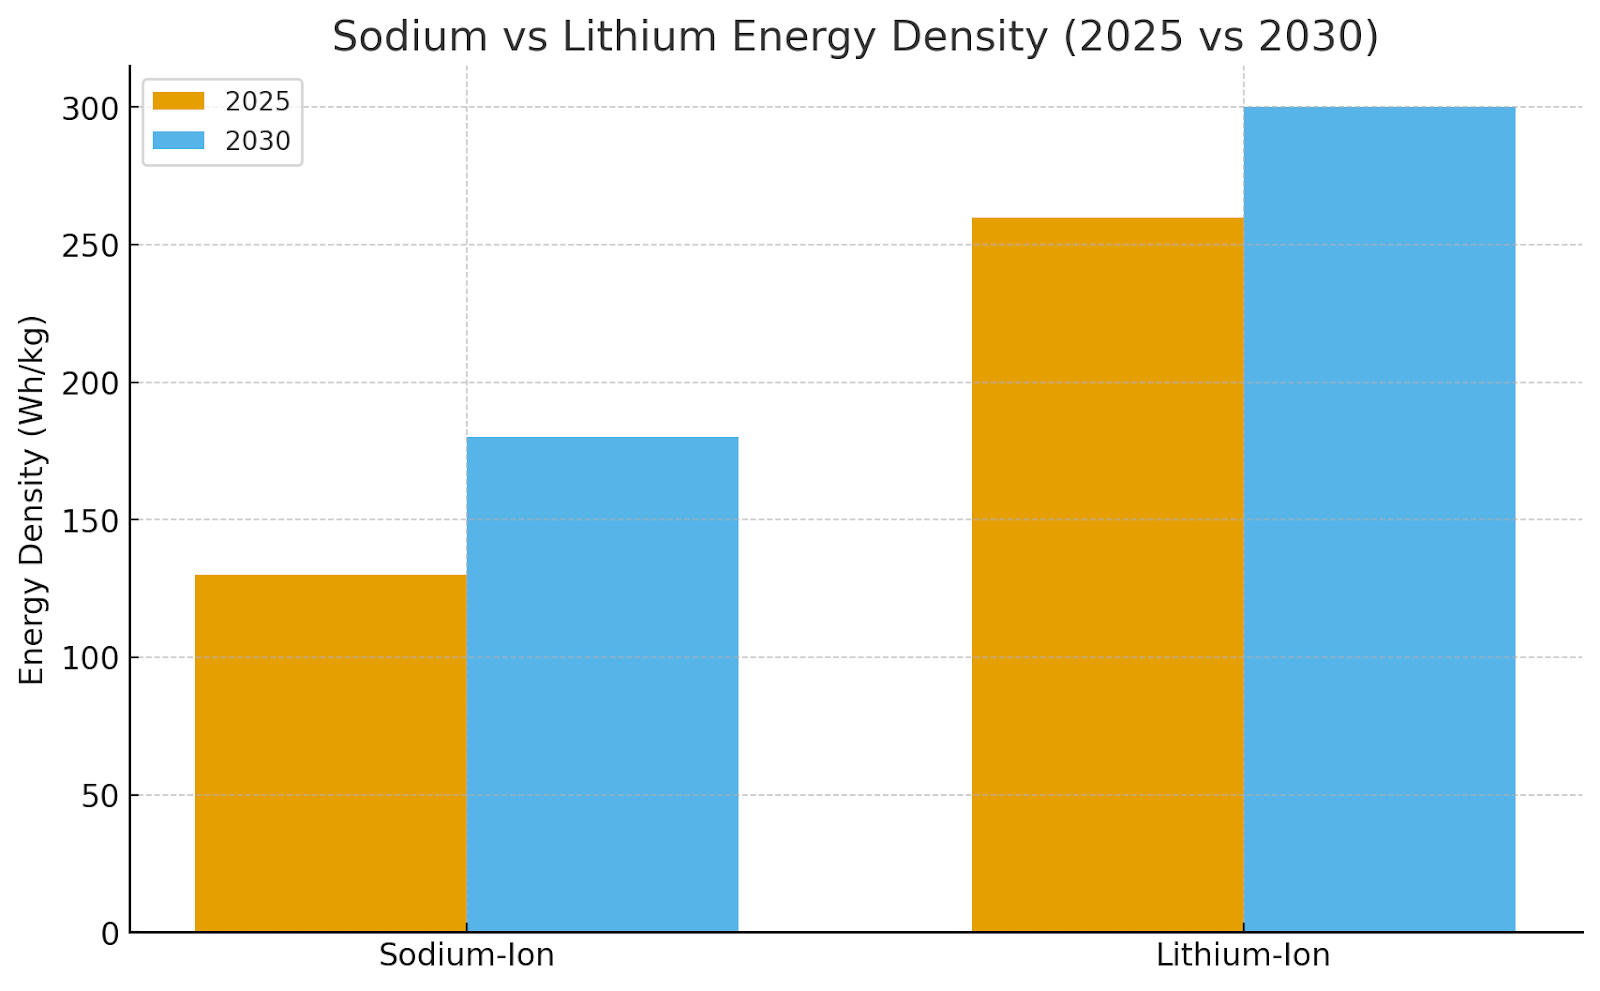
Current sodium-ion limitations include lower energy density (160–180 Wh/kg vs 250–300 Wh/kg for Li-ion) and suboptimal cycle life (~2,000 cycles). R&D efforts by Faradion and Tiamat Energy target density gains via hard carbon anodes and Prussian white cathodes. Thermal stability is an advantage, reducing fire risk by 25–30%. Key engineering focus through 2027 remains electrolyte optimization and mass-production standardization.
Competitive Landscape & Leading Manufacturers
CATL leads commercialization with Na-ion battery packs integrated into Chery and Sehol EVs. Faradion (India/UK) and HiNa Battery (China) are major cell developers, while Northvolt and BYD plan hybrid Na-Li product lines by 2027. Patent filings for Na-ion tech rose 4.5x from 2021–2024. Supply chain verticalization — especially in China — provides a 20% cost edge. Europe trails with pilot-scale production under Tiamat and Altris initiatives.
Raw Material Supply & Availability
Unlike lithium, sodium resources are geographically ubiquitous — primarily derived from seawater and soda ash. Raw sodium feedstock prices are 99% less volatile than lithium, ensuring predictable supply chains. Sodium carbonate capacity (~80 Mt globally) easily meets 2030 battery-grade demand of 5.5 Mt. The absence of cobalt and nickel cuts ESG risk and reduces mining dependency. China, India, and the U.S. collectively control >60% of sodium refining capacity.
Regional Commercialization Outlook (2025–2030)
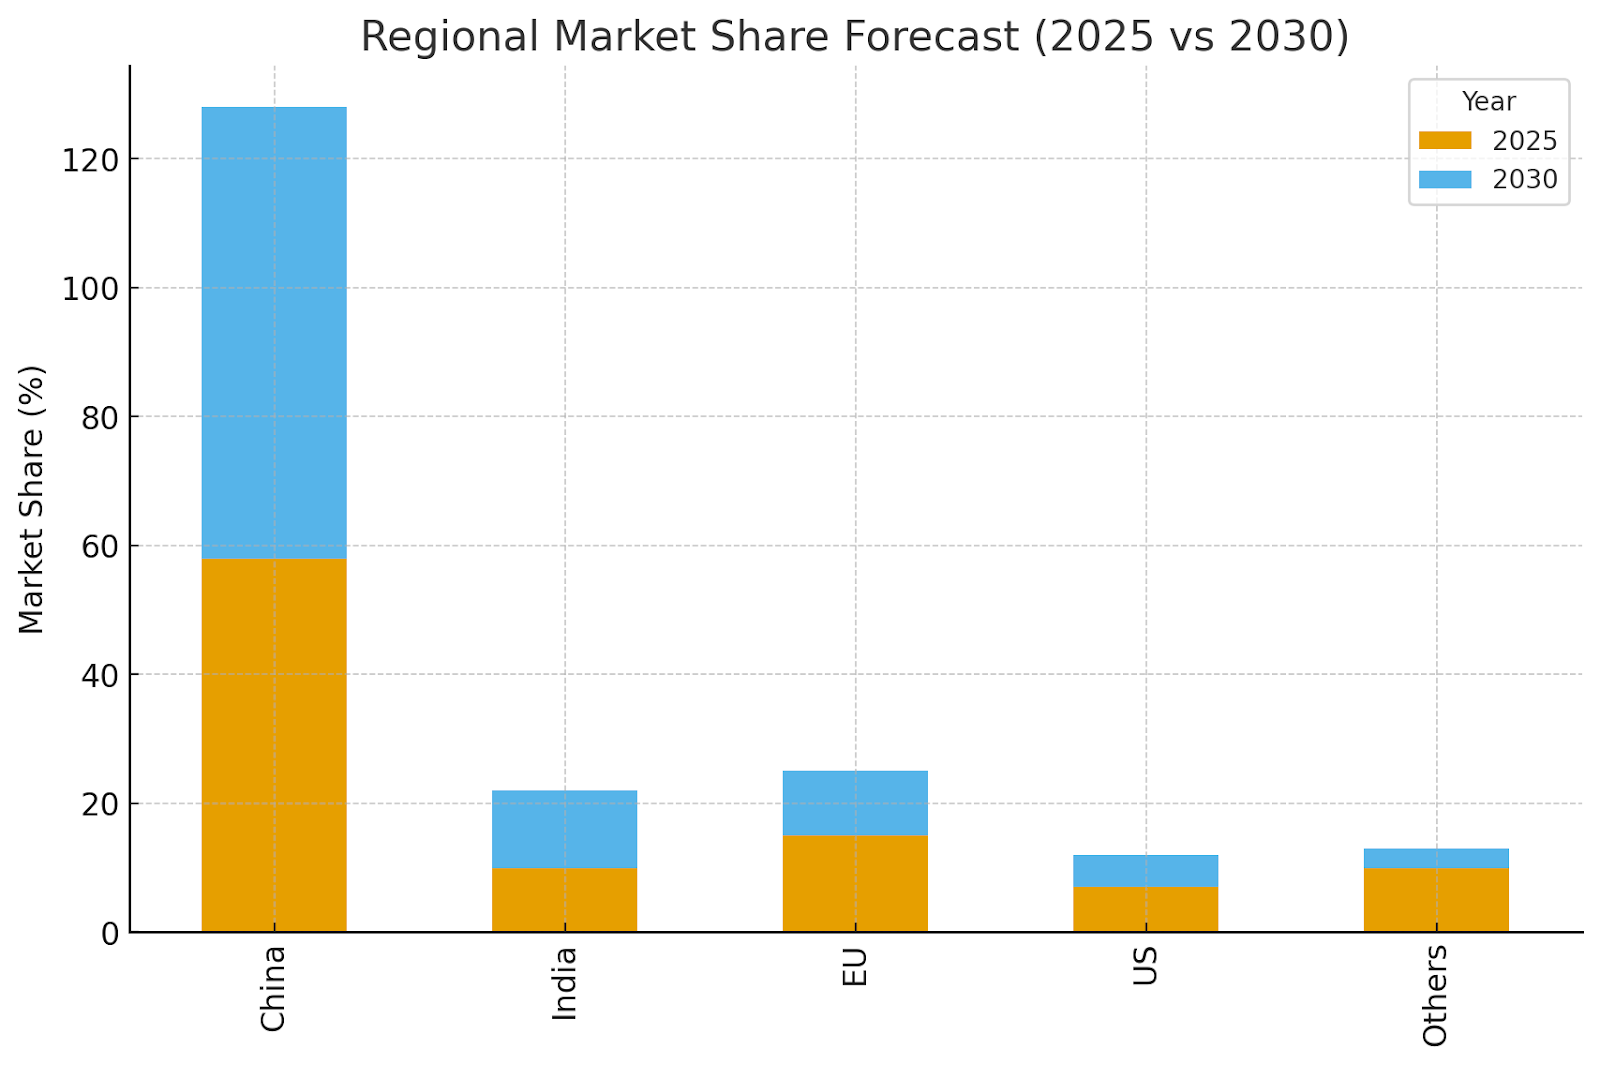
China dominates Na-ion battery manufacturing with over 70% capacity by 2027, led by CATL and HiNa. India and the EU emerge as secondary hubs; Reliance and Tata Chemicals target 6–8 GWh combined capacity by 2030. Europe’s focus is stationary storage; India’s is two-wheelers. U.S. adoption lags due to policy gaps but could accelerate post-2028 with DOE-backed pilot programs.
OEM & Supplier Margin Optimization Strategies
OEMs are leveraging Na-ion packs to reduce dependence on lithium volatility and cut pack cost-to-sales ratio from 22% to 16% by 2030. BYD’s hybrid LFP–Na-ion platforms optimize cell integration, while Tata Motors plans sodium-based EVs under $10,000. Suppliers are co-locating cathode and pack assembly plants to minimize logistics and tariffs, saving ~$7–8/kWh. Enhanced thermal tolerance reduces need for expensive BMS systems.
Risks & Bottlenecks to Commercialization
Despite cost advantages, challenges include low energy density and limited charging infrastructure compatibility. Investment risks stem from uncertain automotive demand and lack of global standards. If energy density improvements stall below 170 Wh/kg, mass EV adoption could be delayed by 2–3 years. Dependence on Chinese supply chains also poses geopolitical risks. Analysts expect cost parity with LFP only by 2028 if large-scale localization occurs.
Roadmap for Energy Density & Commercialization (2025–2030)

By 2030, Na-ion is projected to reach 180 Wh/kg energy density and 2,500 cycle life, narrowing the performance gap with LFP. Hybrid chemistries (Na–Li blends) may enter market by 2027, enabling flexible manufacturing lines. Global capacity expansion to 110 GWh reflects strong investment from CATL, BYD, Reliance, and Northvolt.
Key Takeaways
- Sodium-ion pack costs to drop from $82/kWh (2025) to $60/kWh (2030) — ~27% reduction.
- CATL, Faradion, and HiNa Battery lead global commercialization, with BYD and Northvolt entering by 2026–27.
- Na-ion batteries expected to capture 12–15% share of global energy storage by 2030.
- Zero lithium/nickel/cobalt dependency improves material stability and ESG scores.
- China leads deployment, accounting for 70% of manufacturing capacity by 2027.
- Best-fit applications: two-wheelers, LCVs, and stationary storage markets.
Report Details
Proceed To Buy
Want a More Customized Experience?
- Request a Customized Transcript: Submit your own questions or specify changes. We’ll conduct a new call with the industry expert, covering both the original and your additional questions. You’ll receive an updated report for a small fee over the standard price.
- Request a Direct Call with the Expert: If you prefer a live conversation, we can facilitate a call between you and the expert. After the call, you’ll get the full recording, a verbatim transcript, and continued platform access to query the content and more.
68 Circular Road, #02-01 049422, Singapore
Revenue Tower, Scbd, Jakarta 12190, Indonesia
4th Floor, Pinnacle Business Park, Andheri East, Mumbai, 400093
Cinnabar Hills, Embassy Golf Links Business Park, Bengaluru, Karnataka 560071
Request Custom Transcript
Related Transcripts
$ 1445

68 Circular Road, #02-01 049422, Singapore
Revenue Tower, Scbd, No.52-53, Jakarta 12190, Indonesia
Cinnabar Hills, Embassy Golf Links Business Park, Bengaluru, Karnataka 560071
4th Floor, Pinnacle Business Park, Andheri East, Mumbai, 400093


68 Circular Road, #02-01 049422, Singapore
Revenue Tower, Scbd, Jakarta 12190, Indonesia
4th Floor, Pinnacle Business Park, Andheri East, Mumbai, 400093
Cinnabar Hills, Embassy Golf Links Business Park, Bengaluru, Karnataka 560071