

68 Circular Road, #02-01 049422, Singapore
Revenue Tower, Scbd, Jakarta 12190, Indonesia
4th Floor, Pinnacle Business Park, Andheri East, Mumbai, 400093
Cinnabar Hills, Embassy Golf Links Business Park, Bengaluru, Karnataka 560071


Connect With Us


68 Circular Road, #02-01 049422, Singapore
Revenue Tower, Scbd, Jakarta 12190, Indonesia
4th Floor, Pinnacle Business Park, Andheri East, Mumbai, 400093
Cinnabar Hills, Embassy Golf Links Business Park, Bengaluru, Karnataka 560071
Connect With Us
68 Circular Road, #02-01 049422, Singapore
Revenue Tower, Scbd, Jakarta 12190, Indonesia
4th Floor, Pinnacle Business Park, Andheri East, Mumbai, 400093
Cinnabar Hills, Embassy Golf Links Business Park, Bengaluru, Karnataka 560071
Request Custom Transcript
Retail Media Networks in the U.S. & EU: Ad Revenue Growth, ROI Benchmarks & Brand Access Models
Retail Media Networks (RMNs) have become core to retailer profitability and advertiser reach, transforming retail from a low-margin trade business into a high-margin media ecosystem. Between 2025 and 2030, combined U.S. and EU RMN ad revenues are projected to grow from ~US$38B to ~US$83B, reflecting a CAGR of 16%. U.S. markets lead in first-party data and automation maturity, while EU markets advance on privacy-by-design and premium omnichannel experiences. The ROI stack now defines competitiveness. U.S. networks deliver incremental ROAS of ~3.8x with retailer ROI near 32% and advertiser ROI ~29%; EU peers average 3.2x, 28%, and 25%, respectively. The widening gap stems from faster self-serve adoption and unified identity layers in the U.S., contrasted with EU fragmentation and regulatory friction. Yet EU’s premium ad yield and cross-media synchronization offer higher brand trust and long-term sustainability.

What's Covered?
Report Summary
Key Takeaways
1. U.S. and EU RMN revenues double by 2030, led by authenticated audiences and closed-loop ROI.
2. Incremental ROAS improves as identity graphs and attribution standards mature.
3. U.S. dominance comes from faster API and self-service enablement; EU leads in premium media trust.
4. Retailers monetize shopper attention with scalable adtech and transparent performance metrics.
5. Preferred and self-service models democratize RMN access for mid-size brands.
6. Interoperability, privacy compliance, and data-sharing governance remain critical barriers.
7. Unified ROI benchmarks drive capital reallocation from upper-funnel to commerce-driven budgets.
8. CFO dashboard: revenue growth, ROI %, ad yield, access model share, and media waste reduction.
Key Metrics

Market Size & Share
RMN ad revenues across the U.S. and EU are modeled to expand from ~US$38B in 2025 to ~US$83B by 2030, at a CAGR of ~16%. U.S. networks account for ~60% of spend, driven by scale and automation, while EU networks capture 40%, supported by premium placements and omnichannel maturity. The line figure illustrates this compounding growth.
By category, grocery and mass retail anchor the ecosystem (~42% share), followed by electronics (~18%), beauty/personal care (~14%), and home goods (~11%). Growth accelerates in travel, pharmacy, and QSR sectors as data partnerships expand. Monetization hinges on authenticated traffic, verified conversions, and interoperable ID layers that unify measurement across online and in-store. Execution risks: siloed data, cross-border privacy constraints, and inconsistent creative standards.

Market Analysis
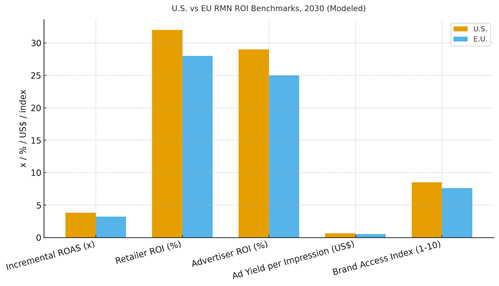
RMN ROI and efficiency benchmarks diverge between the U.S. and EU but converge on closed-loop performance. By 2030, U.S. networks deliver ~3.8x ROAS with higher automation and transparency; EU networks average ~3.2x as regulations emphasize consent and context. Retailer ROI ranges from 28–32%, advertiser ROI 25–29%, and ad yield per impression improves to US$0.64 (U.S.) and US$0.52 (E.U.). The bar chart summarizes comparative KPIs.
Enablers: scalable API-based buying, privacy-safe clean rooms, and AI-driven optimization. Barriers: fragmented currencies, inconsistent viewability standards, and underreported offline attribution. Financially, retailers earn incremental margin dollars per impression while advertisers optimize cross-channel reach and incrementality. Success depends on attribution integrity and data-sharing interoperability.
Trends & Insights
1) RMNs emerge as the second-largest digital ad channel after search. 2) Closed-loop attribution and clean-room integrations standardize ROI proof. 3) Preferred partner and self-service models expand brand accessibility. 4) Dynamic creative optimization (DCO) connects product feeds to ads in real time. 5) Cross-retailer ID graphs drive multi-channel frequency capping and deduplication. 6) Premium shoppable video and CTV inventory attract brand budgets. 7) Interoperable metrics across RMNs simplify media mix modeling. 8) AI-based ad yield management lifts floor prices. 9) Privacy innovations consent APIs and differential privacy enable compliant personalization. 10) RMN data feeds inform upstream product and pricing strategies.
Segment Analysis
Grocery/Mass Retail: High volume, low margin; focus on incrementality and shelf availability. Beauty & Personal Care: Influencer collaboration and shoppable video drive engagement. Electronics: Offsite CTV and onsite bundles dominate. Fashion: Self-service access and creative autonomy increase ROI. Home & DIY: Premium contextual placements and store co-op ads scale. Travel & QSR: Location-based retail audiences power dynamic campaigns. Across segments, track incremental ROAS, ad yield, and verified conversion metrics to allocate capital efficiently.
Geography Analysis
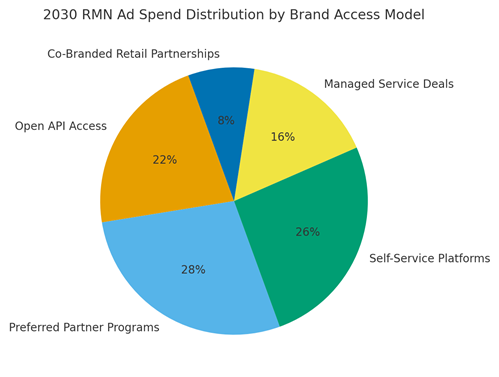
By 2030, ad spend distribution by brand access model is modeled as Preferred Partner Programs (~28%), Self-Service Platforms (~26%), Open API Access (~22%), Managed Service Deals (~16%), and Co-Branded Retail Partnerships (~8%). U.S. adoption of APIs and automation drives openness, while EU retailers favor curated partner ecosystems for compliance and quality. The pie figure illustrates the evolving mix.
Execution priorities: centralize measurement and data governance; harmonize taxonomy and consent signals; and expand retail media cross-network exchanges to reduce fragmentation. Regional success hinges on transparency, scale, and sustainable advertiser trust.
Competitive Landscape
U.S. leaders (Amazon, Walmart Connect, Target Roundel) dominate scale, while EU players (Tesco Media, Carrefour Links, Ahold Connect, Schwarz Media) lead on privacy and omnichannel integration. Differentiation vectors: (1) authenticated traffic, (2) clean-room interoperability, (3) retail media stack ownership, (4) brand experience quality, and (5) cross-border compliance maturity. Procurement guidance: prioritize RMNs with transparent attribution, auditable APIs, and measurable sales lift. Competitive KPIs: ROAS, ad yield, access model mix, verified conversions, and cost per incremental sale.
Report Details
Proceed To Buy
Want a More Customized Experience?
- Request a Customized Transcript: Submit your own questions or specify changes. We’ll conduct a new call with the industry expert, covering both the original and your additional questions. You’ll receive an updated report for a small fee over the standard price.
- Request a Direct Call with the Expert: If you prefer a live conversation, we can facilitate a call between you and the expert. After the call, you’ll get the full recording, a verbatim transcript, and continued platform access to query the content and more.
68 Circular Road, #02-01 049422, Singapore
Revenue Tower, Scbd, Jakarta 12190, Indonesia
4th Floor, Pinnacle Business Park, Andheri East, Mumbai, 400093
Cinnabar Hills, Embassy Golf Links Business Park, Bengaluru, Karnataka 560071
Request Custom Transcript
Related Transcripts


68 Circular Road, #02-01 049422, Singapore
Revenue Tower, Scbd, No.52-53, Jakarta 12190, Indonesia
Cinnabar Hills, Embassy Golf Links Business Park, Bengaluru, Karnataka 560071
4th Floor, Pinnacle Business Park, Andheri East, Mumbai, 400093


68 Circular Road, #02-01 049422, Singapore
Revenue Tower, Scbd, Jakarta 12190, Indonesia
4th Floor, Pinnacle Business Park, Andheri East, Mumbai, 400093
Cinnabar Hills, Embassy Golf Links Business Park, Bengaluru, Karnataka 560071