

68 Circular Road, #02-01 049422, Singapore
Revenue Tower, Scbd, Jakarta 12190, Indonesia
4th Floor, Pinnacle Business Park, Andheri East, Mumbai, 400093
Cinnabar Hills, Embassy Golf Links Business Park, Bengaluru, Karnataka 560071


Connect With Us


68 Circular Road, #02-01 049422, Singapore
Revenue Tower, Scbd, Jakarta 12190, Indonesia
4th Floor, Pinnacle Business Park, Andheri East, Mumbai, 400093
Cinnabar Hills, Embassy Golf Links Business Park, Bengaluru, Karnataka 560071
Connect With Us
68 Circular Road, #02-01 049422, Singapore
Revenue Tower, Scbd, Jakarta 12190, Indonesia
4th Floor, Pinnacle Business Park, Andheri East, Mumbai, 400093
Cinnabar Hills, Embassy Golf Links Business Park, Bengaluru, Karnataka 560071
Request Custom Transcript
Plastic-to-Fuel Industry: Innovations in Pyrolysis Reactors & Emission Control Technologies
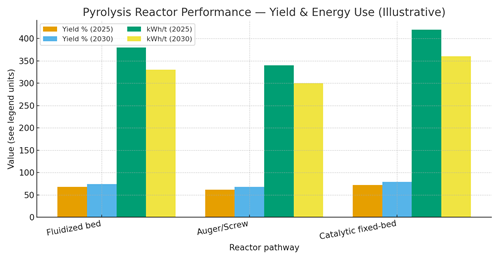
Between 2025 and 2030, Europe’s plastic‑to‑fuel (PtF) industry shifts from scattered pilots to scaled clusters linked to refineries and chemical crackers. Germany emerges as a hub for standardized feedstock preparation, advanced pyrolysis reactors, and emissions‑controlled upgrading, while the Netherlands and Belgium anchor offtake via integrated petrochemical complexes. Three reactor lanes compete and converge: fluidized beds (throughput, heat transfer, stability), auger/screw (compact, modular, mixed‑waste tolerance), and catalytic fixed‑beds (higher liquids yield/quality, tighter feed specs). Across the period, yields improve 6–8 points and specific energy use falls as heat integration and control systems mature. Emission control moves center‑stage. Best‑available techniques include staged thermal oxidizers or RTOs, acid gas scrubbing for HCl/HF, activated carbon for dioxins/furans, low‑NOx burners, and continuous emissions monitoring (CEMS) for VOCs and particulates. Post‑cracking, hydrotreating/upgrading units reduce sulfur, nitrogen, and oxygenates to meet refinery/chemical specs. Co‑processing with FCC/hydrocrackers requires tight contaminant control and traceability.
What's Covered?
Report Summary
Key Takeaways
1) Feedstock prep + reactor control + emissions‑compliant upgrading determine bankability.
2) Catalytic fixed‑beds raise liquids quality; require tight feed and catalyst care.
3) Fluidized beds win on throughput/stability; auger reactors are modular and tolerant.
4) CEMS + RTO + scrubbers + filtration + low‑NOx become standard for EU permits.
5) Spec‑based offtake unlocks co‑processing and premium pricing.
6) Energy intensity drops ~10–15% via heat recovery and controls.
7) DE/NL/BE lead readiness; FR/UK/Nordics follow with policy and clusters.
8) Outcome‑based contracts: yield %, uptimes, specs, and emissions KPIs.
Key Metrics

Market Size & Share
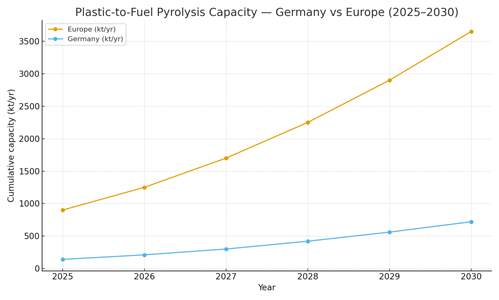
Europe’s PtF build‑out concentrates near refineries and chemical parks where feedstock, utilities, hydrogen, and hydro processing exist. In this illustrative outlook, Europe scales from ~0.9 Mt/yr (2025) to ~3.65 Mt/yr (2030); Germany rises from ~0.14 to ~0.72 Mt/yr as standardized pre‑processing and permitting converge. Share accrues to integrators that control feed, operate robust reactors, and deliver spec‑compliant products with auditable emissions. Co‑processing into FCC/hydrocrackers and naphtha‑to‑chemicals provide diversified routes reducing exposure to fuel pricing cycles. As clusters mature, bankable offtake shortens payback and lowers cost of capital.
Market Analysis
Reactor selection: fluidized beds for high‑throughput polyolefins with strong heat transfer; auger/screw for mixed streams and modular roll‑out; catalytic fixed‑beds for higher liquids yield and quality at the cost of stricter feed control and catalyst management. By 2030, yields improve 6–8 points and specific energy use declines 10–15% in this outlook. Emissions control is design‑basis RTOs, acid gas scrubbers, filtration/activated carbon, and low‑NOx burners—verified by CEMS. Economics hinge on feed cost/quality, uptime, utilities (H₂, power), and offtake discounts. Risk mitigations: long‑term feed contracts with specs, heat recovery, and outcome‑linked offtake with quality warranties and penalties for non‑conformance.
Trends & Insights (2025–2030)
• Standardized pre‑processing (sorting, shredding, de‑chlorination) stabilizes operations and protects catalysts.
• Model‑predictive control and digital twins optimize yield split and energy intensity.
• Emissions‑by‑design: RTO + scrubbers + filtration + CEMS integrated from FEED; public reporting builds trust.
• Spec‑based co‑processing contracts with shared QA/QC labs and chain‑of‑custody data.
• Catalyst advances extend run lengths and reduce poisons’ impact; regeneration and circulation strategies mature.
• Product diversification: naphtha/wax to chemicals, heavier fractions to marine/distillate via hydrotreating.
• Performance‑linked finance/insurance indexed to verified emissions and product quality.
• Circular branding and recycled‑carbon accounting support pricing premia and compliance.
Segment Analysis
• Municipal/MRF feed: auger or fluidized reactors with strong pre‑processing and emissions control.
• Industrial polyolefins: fluidized or catalytic fixed‑bed for naphtha‑quality products and refinery co‑processing.
• Laminates/multilayer films: catalytic emphasis with hydrotreating; manage chlorine and metals carefully.
• Chemical/refinery parks: integrated utilities and QA/QC; superior permitting cadence and offtake access.
Buyer guidance: match reactor to feed; design emissions controls into FEED; secure spec‑based offtakes; implement heat recovery and advanced controls; and contract outcome KPIs with independent MRV.
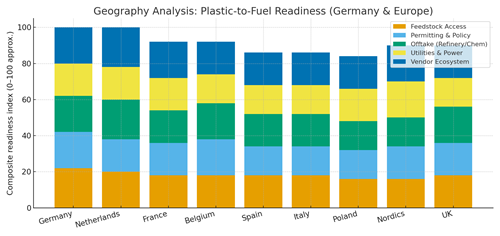
Geography Analysis (Germany & Europe)
Germany, the Netherlands, and Belgium lead readiness given feedstock aggregation, permitting clarity, and offtake integration. France and the UK scale with policy support and industrial clusters; Nordics benefit from clean utilities and vendor ecosystems; Spain and Italy advance as permitting and offtake relationships mature. The stacked criteria feed access, permitting/policy, offtake, utilities/power, vendor ecosystem—highlight where to sequence investments and partnerships.
Implications: co‑locate with refineries/chemical parks; standardize pre‑processing; embed emissions and CEMS from design; and pursue outcome‑linked contracts (yield, uptime, spec compliance).
Competitive Landscape (Ecosystem & Delivery Models)
Competitors include feedstock aggregators, reactor OEMs, emissions‑control vendors, upgrading specialists, and refinery/chemical offtakers. Differentiators: yield and uptime with real‑world feed, verified emissions compliance, energy intensity, and spec‑compliant product delivery. Leaders offer integrated solutions from pre‑processing through upgrading with CEMS‑backed MRV and outcome‑based contracts. Delivery models shift to BOO/BOOT with long‑term offtakes that warrant specs and uptime; financiers reward verifiable emissions and quality performance. Portfolios that combine robust engineering with rigorous emissions and quality assurance will capture Europe’s PtF growth through 2030.
Report Details
Proceed To Buy
Want a More Customized Experience?
- Request a Customized Transcript: Submit your own questions or specify changes. We’ll conduct a new call with the industry expert, covering both the original and your additional questions. You’ll receive an updated report for a small fee over the standard price.
- Request a Direct Call with the Expert: If you prefer a live conversation, we can facilitate a call between you and the expert. After the call, you’ll get the full recording, a verbatim transcript, and continued platform access to query the content and more.
68 Circular Road, #02-01 049422, Singapore
Revenue Tower, Scbd, Jakarta 12190, Indonesia
4th Floor, Pinnacle Business Park, Andheri East, Mumbai, 400093
Cinnabar Hills, Embassy Golf Links Business Park, Bengaluru, Karnataka 560071
Request Custom Transcript
Related Transcripts


68 Circular Road, #02-01 049422, Singapore
Revenue Tower, Scbd, No.52-53, Jakarta 12190, Indonesia
Cinnabar Hills, Embassy Golf Links Business Park, Bengaluru, Karnataka 560071
4th Floor, Pinnacle Business Park, Andheri East, Mumbai, 400093


68 Circular Road, #02-01 049422, Singapore
Revenue Tower, Scbd, Jakarta 12190, Indonesia
4th Floor, Pinnacle Business Park, Andheri East, Mumbai, 400093
Cinnabar Hills, Embassy Golf Links Business Park, Bengaluru, Karnataka 560071