

68 Circular Road, #02-01 049422, Singapore
Revenue Tower, Scbd, Jakarta 12190, Indonesia
4th Floor, Pinnacle Business Park, Andheri East, Mumbai, 400093
Cinnabar Hills, Embassy Golf Links Business Park, Bengaluru, Karnataka 560071


Connect With Us


68 Circular Road, #02-01 049422, Singapore
Revenue Tower, Scbd, Jakarta 12190, Indonesia
4th Floor, Pinnacle Business Park, Andheri East, Mumbai, 400093
Cinnabar Hills, Embassy Golf Links Business Park, Bengaluru, Karnataka 560071
Connect With Us
68 Circular Road, #02-01 049422, Singapore
Revenue Tower, Scbd, Jakarta 12190, Indonesia
4th Floor, Pinnacle Business Park, Andheri East, Mumbai, 400093
Cinnabar Hills, Embassy Golf Links Business Park, Bengaluru, Karnataka 560071
Request Custom Transcript
Offshore Wind Turbines: Floating Platform Innovations
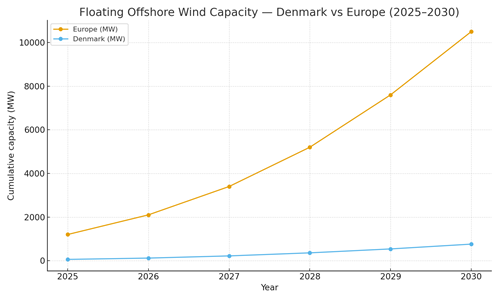
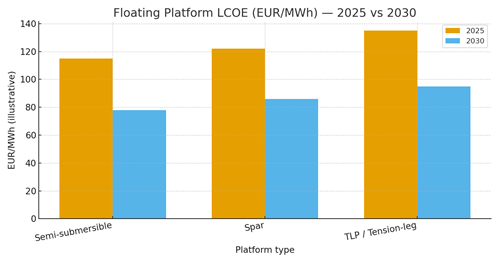
From 2025 to 2030, floating offshore wind (FOW) transitions from pilot arrays to early utility scale in Europe, with Denmark positioned as a technology proving ground for serial fabrication, modular moorings, and grid integration. As bottom‑fixed sites in shallow waters saturate, FOW unlocks higher‑resource, deeper zones, enabling country‑level decarbonization targets and green electrification of power‑to‑X clusters. Three platform classes dominate: semi‑submersibles (logistics‑friendly, broad metocean envelope), spars (excellent stability where draft and wet tow are feasible), and tension‑leg platforms (TLPs) for low pitch/roll in constrained footprints. Turbine ratings rise toward 18–20 MW, driving fewer units per GW and lowering BOS costs. Illustratively, cumulative floating capacity in Europe could grow from ~1.2 GW in 2025 to ~10.5 GW by 2030, with Denmark rising from ~60 MW to ~760 MW as serial assembly lines, large‑component ports, and standardized mooring/anchor kits mature. Levelized cost of energy (LCOE) trends down as learning effects compound: semi‑subs decline from ~€115/MWh to ~€78/MWh, spars from ~€122/MWh to ~€86/MWh, and TLPs from ~€135/MWh to ~€95/MWh in this outlook. Key levers include hull standardization, robotic welding and NDT, wet tow logistics, rapid‑connect dynamic cables, and shared offshore substations. Floating HVDC and grid‑forming converters improve system strength and export reliability.
What's Covered?
Report Summary
Key Takeaways
1) Semi‑subs lead early; spars win where deep‑draft wet tow works; TLPs suit constrained footprints.
2) LCOE falls toward ~€78–95/MWh by 2030 with 18–20 MW turbines and serial fabrication.
3) Ports and modular hull lines are the gating assets quay depth, laydown, and heavy‑lift.
4) Mooring/cable reliability and weather windows dominate availability and OPEX.
5) Grid‑forming converters and floating HVDC strengthen export and curtailment risk.
6) Outcome‑based EPC/O&M with shared spares improves bankability and uptime.
7) Denmark + Norway/UK/France/Spain/Portugal anchor Europe’s first multi‑GW wave.
8) Digital twins, robotic NDT, and condition monitoring compress OPEX and risk.
Key Metrics

Market Size & Share
Floating offshore wind becomes Europe’s growth engine once shallow‑water bottom‑fixed options saturate. In this illustrative outlook, cumulative floating capacity scales from ~1.2 GW in 2025 to ~10.5 GW by 2030, with Denmark moving from ~60 MW to ~760 MW as serial hull fabrication lines and large‑component ports unlock repeatable delivery. Share accrues to countries with the right combination of resource, port logistics, and grid access Norway and the UK leverage deep‑water resource and supply chains; France, Spain and Portugal scale Mediterranean and Atlantic leases; Denmark serves as a serial‑assembly and operations hub for the Baltic and North Sea.
Developer share concentrates around consortia that pair OEM turbine roadmaps (18–20 MW) with standardized hulls, moorings, and dynamic cables. EPCs with robotic welding/NDT, wet tow expertise, and rapid offshore hook‑up seize schedule advantage. As arrays expand, shared offshore substations and floating HVDC lower export bottlenecks and curtailment. Portfolio‑level O&M with shared spares pools and outcome‑based availability contracts raise bankability and capacity factors.
Market Analysis
LCOE declines are driven by turbine up‑rating, hull standardization, port logistics, and reliability gains. Semi‑subs benefit from broad metocean compatibility and ease of fabrication; spars trade superior stability for deep‑draft requirements; TLPs reduce pitch/roll but demand precise mooring and seabed anchors. In this outlook, indicative LCOE trends fall from ~€115/122/135 MWh in 2025 (semi/spar/TLP) toward ~€78/86/95 MWh by 2030 as serial production, learning rates, and supply‑chain depth increase. Sensitivities include steel prices, crane/vessel day rates, dynamic cable failure rates, and weather window logistics. A one‑point improvement in array availability can lift energy yield materially across a 20‑year PPA.
Bankability hinges on proven mooring/cable designs, robust QA/QC in fabrication, and outcome‑based O&M. Mitigations include redundant monitoring (strain, vibration, cable temperature), pre‑installed anchors, modular substations, and chartered heavy‑lift capacity. Procurement is shifting to performance‑linked EPC and availability‑indexed O&M with LDs/bonuses tied to yield and repair time.
Trends & Insights (2025–2030)
• 18–20 MW turbines become standard on floating platforms, reducing units per GW and BOS costs.
• Serial hull fabrication and modular mooring/anchor kits cut cycle time and schedule risk.
• Dynamic export cables and shared substations accelerate hook‑up; floating HVDC pilots reduce curtailment risk.
• Digital twins, robotic NDT, and condition‑based maintenance lift availability and trim OPEX.
• Weather‑robust logistics: wet tow corridors, pre‑installed anchors, and hook‑up windows shorten offshore time.
• Outcome‑based contracts: availability/repair‑time KPIs with shared spares pools become the norm.
• Cyber‑secure SCADA and grid‑forming converters strengthen grid integration and resilience.
• Sustainability: low‑impact anchors and recyclable materials gain weight in permitting and offtake.
Segment Analysis
• Deep‑water Atlantic (Spain/Portugal/France): semi‑subs dominate early arrays; robust wave environments require conservative moorings.
• North Sea/Baltic (Denmark/Netherlands/Germany/UK): mixed semi‑subs and TLPs near ports; strong grid interconnect and offtake options.
• Norway: spar opportunities with deep drafts and wet‑tow logistics; synergies with offshore supply chains.
Buyer guidance: match platform class to metocean/port constraints; secure port upgrades (quay, draft, laydown) early; specify availability/repair KPIs; deploy digital monitoring; and plan phased expansions with standardized modules and shared spares.
Geography Analysis (Denmark & Europe)
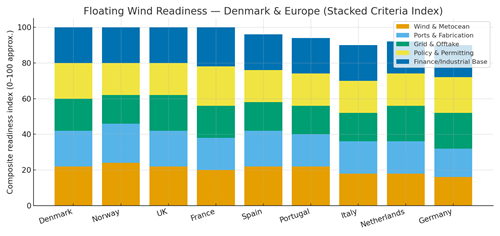
Denmark combines favorable wind resource with strong ports and grid access; Norway and the UK bring deep‑water expertise and robust supply chains; France, Spain, and Portugal provide policy momentum and Atlantic resource; the Netherlands and Germany add grid/offtake strengths and fabrication capacity. The stacked‑criteria view (resource/metocean, ports/fabrication, grid/offtake, policy/permitting, finance/industrial base) highlights complementary strengths across the region and suggests sequencing: launch serial arrays where port upgrades are complete and grid export risk is lowest, then expand along wet‑tow corridors as fabrication scales.
Implications: prioritize port investments and dynamic cable readiness; align export schemes to limit curtailment; and harmonize availability KPIs across markets to enable vendor competition.
Competitive Landscape (Ecosystem & Delivery Models)
Competition spans turbine OEMs, hull designers/fabricators, mooring/anchor specialists, dynamic cable OEMs, and grid/export integrators. Differentiators: serial fabrication capability, mooring/cable reliability, logistics execution (wet tow/hook‑up), and outcome‑based O&M. Leaders pair engineering depth with schedule reliability and bankable availability KPIs. Partnerships with ports and heavy‑lift providers secure critical path resources. Digital twins and MRV for availability/repair time become core to financing. Delivery models evolve from EPC lumpsum toward performance‑linked packages: guaranteed availability, repair times, and energy yield baselined to metocean conditions. Vendors that standardize modules, de‑risk cables/moorings, and integrate grid‑forming/export solutions will capture Europe’s first multi‑GW floating wave by 2030.
Report Details
Proceed To Buy
Want a More Customized Experience?
- Request a Customized Transcript: Submit your own questions or specify changes. We’ll conduct a new call with the industry expert, covering both the original and your additional questions. You’ll receive an updated report for a small fee over the standard price.
- Request a Direct Call with the Expert: If you prefer a live conversation, we can facilitate a call between you and the expert. After the call, you’ll get the full recording, a verbatim transcript, and continued platform access to query the content and more.
68 Circular Road, #02-01 049422, Singapore
Revenue Tower, Scbd, Jakarta 12190, Indonesia
4th Floor, Pinnacle Business Park, Andheri East, Mumbai, 400093
Cinnabar Hills, Embassy Golf Links Business Park, Bengaluru, Karnataka 560071
Request Custom Transcript
Related Transcripts


68 Circular Road, #02-01 049422, Singapore
Revenue Tower, Scbd, No.52-53, Jakarta 12190, Indonesia
Cinnabar Hills, Embassy Golf Links Business Park, Bengaluru, Karnataka 560071
4th Floor, Pinnacle Business Park, Andheri East, Mumbai, 400093


68 Circular Road, #02-01 049422, Singapore
Revenue Tower, Scbd, Jakarta 12190, Indonesia
4th Floor, Pinnacle Business Park, Andheri East, Mumbai, 400093
Cinnabar Hills, Embassy Golf Links Business Park, Bengaluru, Karnataka 560071