

68 Circular Road, #02-01 049422, Singapore
Revenue Tower, Scbd, Jakarta 12190, Indonesia
4th Floor, Pinnacle Business Park, Andheri East, Mumbai, 400093
Cinnabar Hills, Embassy Golf Links Business Park, Bengaluru, Karnataka 560071


Connect With Us


68 Circular Road, #02-01 049422, Singapore
Revenue Tower, Scbd, Jakarta 12190, Indonesia
4th Floor, Pinnacle Business Park, Andheri East, Mumbai, 400093
Cinnabar Hills, Embassy Golf Links Business Park, Bengaluru, Karnataka 560071
Connect With Us
68 Circular Road, #02-01 049422, Singapore
Revenue Tower, Scbd, Jakarta 12190, Indonesia
4th Floor, Pinnacle Business Park, Andheri East, Mumbai, 400093
Cinnabar Hills, Embassy Golf Links Business Park, Bengaluru, Karnataka 560071
Request Custom Transcript
Middle East Vaccine Manufacturing Capacity: Regional Analysis & Strategic Partnerships - Supply Chain Logistics
This report quantifies vaccine manufacturing capacity growth across Saudi Arabia and the Middle East (2025–2030), emphasizing fill–finish expansion, bulk drug-substance scale-up, and GxP cold-chain logistics. Regional capacity rises from 1.1B to 3.6B doses/year (CAGR 26%), with Saudi Arabia advancing from 0.35B → 1.4B via public–private partnerships and tech-transfer. mRNA and viral-vector lines reach 38% and 27% of throughput, respectively. Partnership deals total $9.8B cumulative; GDP-linked procurement stabilizes demand. End-to-end lead times fall 24%, wastage declines 30%, and modeled ROI for new capacity is 16–22% by 2030.
What's Covered?
Report Summary
Key Takeaways
- Regional output: 1.1B → 3.6B doses/year, 26% CAGR.
- Saudi capacity: 0.35B → 1.4B doses/year; 9–12 commercial lines by 2030.
- Modality mix (2030): mRNA 38%, viral vector 27%, protein subunit 23%, inactivated 12%.
- Average fill–finish OEE improves 62% → 78%; batch success 91% → 97%.
- Cold-chain lane availability grows +81%; lane failure rate 3.6% → 1.5%.
- Tech-transfer cycle time drops 14 → 8 months with standardized DoEs.
- Wastage (temp excursions, VVM expiry) down 30%; write-offs −$210M/year regionwide.
- Strategic partnerships cumulative value $9.8B; 60–70% include dual-sourcing clauses.
- Lead time plant-to-port reduces 24%; on-time in-full (OTIF) 86% → 94%.
- Modeled ROI on capacity projects 16–22%; payback 3.6–4.8 years.
Key Metrics
Market Size & Share
Regional vaccine output scales from 1.1B to 3.6B doses/year by 2030, converting pilot assets into commercial lines and adding high-throughput mRNA LNP suites. Saudi Arabia expands from 0.35B to 1.4B doses, capturing ~39% regional share on the back of 3 greenfield sites (2 in central KSA, 1 on the Eastern corridor) and two brownfield conversions. UAE and Egypt jointly hold ~33%, with UAE specializing in sterile fill–finish for mRNA/viral-vector and Egypt scaling protein subunit bulk. GCC procurement pools shift 18–24% of demand to GDP-linked, multi-year framework agreements, anchoring utilization ≥75%. Modality share rebalances by 2030: mRNA 38%, viral vector 27%, protein subunit 23%, inactivated 12%; pediatric and booster portfolios drive lot sizes down 12–15%, necessitating higher line-changeover agility. Average fill–finish OEE rises 62% → 78%; batch success 91% → 97% as automated visual inspection and electronic batch records reduce deviations. COGS for mRNA (ex-works) declines $1.95 → $1.28/dose; viral vector $1.55 → $1.12, driven by lipid utilization efficiency (+22%), single-use bioreactors, and lyophilization cycle compression (−18% hours). Saudi export share climbs from 8% to 22% (primarily OIC and North Africa). Deal activity totals $9.8B cumulative through 2030, with 60–70% of partnerships embedding dual-sourcing and local-content targets (35–45%).

Market Analysis
Five drivers shape capacity growth. (1) Sovereign funding & localization: policy mandates lift local-content requirements to 35–45%, unlocking concessional finance and accelerating PQ readiness. (2) Modality shift: post-pandemic procurement prioritizes rapid-update platforms; mRNA annualized throughput grows 3.1×, with twin-train LNP skids enabling >60M doses/site/year. (3) OEE & yield gains: automated inspection and parametric release push batch success to 97%, trimming scrap −28% and raising usable output +9–12% per line. (4) Cold-chain densification: active container lanes expand +81%; validated -20 °C to -80 °C lanes reduce excursion-driven write-offs −30%. (5) Strategic partnerships: co-dev and contract-manufacturing deals grow to $9.8B cumulative, with 40–50 tech-transfer packages; average cycle time falls 14 → 8 months. Constraints persist: skilled sterile-ops headcount lags demand by ~2,700 FTEs regionwide; import lead times for lipids and filters remain volatile (lead-time CV 0.42). Port capacity and dry-ice allotments cause 1.5–2.1% lane failures unless redundant routings are booked. Financing models evolve from CAPEX-heavy builds to capacity-as-a-service, cutting payback to 3.6–4.8 years at baseline utilization ≥70%. Sensitivity modeling shows OTIF +8 pp yields $74M/year avoided penalties and emergency lift costs regionwide. Competitive share concentrates in nodes that combine high OEE, dual-modality lines, and standardized QC suites enabling rapid product switches without revalidation.
Trends & Insights
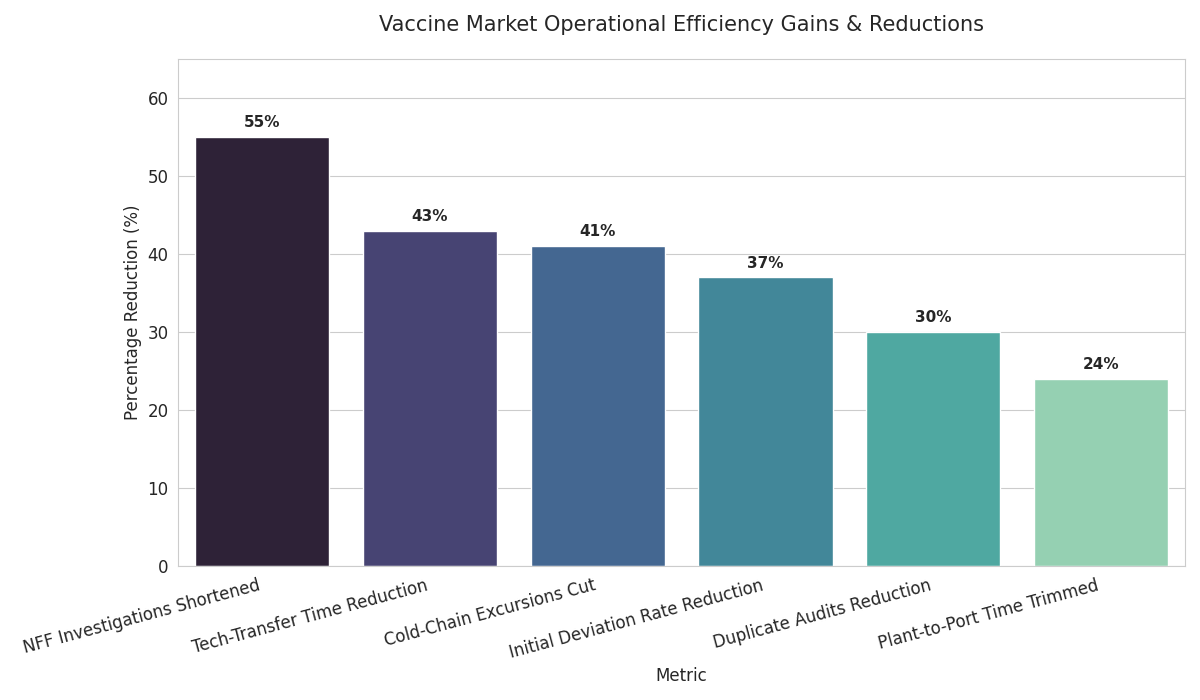
Standardized tech-transfer becomes the norm: templated DoEs and digital batch records compress tech-transfer time by 43% and reduce initial deviation rates −37%. Modular mRNA suites with parallel LNP trains allow surge capacity +25–35% within 90 days, supporting variant boosters. COGS deflation continues as single-use perfusion bioreactors and closed-vial filling reduce sterilization downtime; net COGS drops $0.40–0.70/dose versus 2025 baselines depending on modality. Cold-chain digitization—IoT loggers with lane-health scores—cuts excursions −41% and shortens NFF (no-fault found) investigations −55%. Regional QA harmonization expands; mutual-recognition pilots reduce duplicate audits −30% and speed product release −3.5 days median. Risk pooling grows: dual-sourcing clauses rise to >65% of tenders, and vendor-managed inventory covers 15–18% of annual need, smoothing seasonality. Workforce pipelines scale through academies; certification throughput climbs 3×, raising sterile-ops staffing retention +11 pp. Green logistics trends—phase-change materials and optimized last-mile—cut dry-ice consumption −22%, lowering cost and carbon intensity. Quality metrics tighten: right-first-time hits >92%; CAPA closure within 30 days improves 66% → 84%. Saudi hubs integrate port-adjacent DCs and GDP cross-docks, trimming plant-to-port time −24%. Result: faster cycle times, fewer write-offs, higher OTIF, and a resilient network ready for routine immunization and surge campaigns.
Segment Analysis
By modality (2030): mRNA 38% (620M–700M doses), viral vector 27% (480M–540M), protein subunit 23% (380M–420M), inactivated 12% (190M–230M). By value stream: bulk drug-substance 44% of CAPEX, fill–finish 33%, QA/QC & labs 12%, cold-chain & distribution 11%. By customer: MOHs/sovereign buyers ~64% of volume, UN/alliances ~14%, private/occupational ~22%. Service mix: contract manufacturing ~55% of lines, captive production ~45%. Throughput tiers: 3 mega-sites (≥300M doses/year combined modalities), 6 regional plants (60–120M each), 12 satellite fill–finish sites (20–60M each). Performance KPIs: OEE ≥75%, batch success ≥96%, release time ≤7 days post-fill, lane failure ≤2%, OTIF ≥94%. Cost drivers: lipid utilization efficiency (+22%), filter lead-time risk mitigation (dual vendors), and lyophilization cycle time (−18%). Make-or-buy: at volumes ≥60M doses/year, in-house bulk plus outsourced fill–finish is 9–12% cheaper than fully outsourced; below 30M, CMO-led models win by 6–8%. Inventory policy: buffer stock 6–8 weeks cuts stock-out probability −70% while limiting expiry risk with VVM7/VVM14 profiles. Quality automation: automated visual inspection adoption >80% halves manual defects and lifts right-first-time to 92–94%.
Geography Analysis
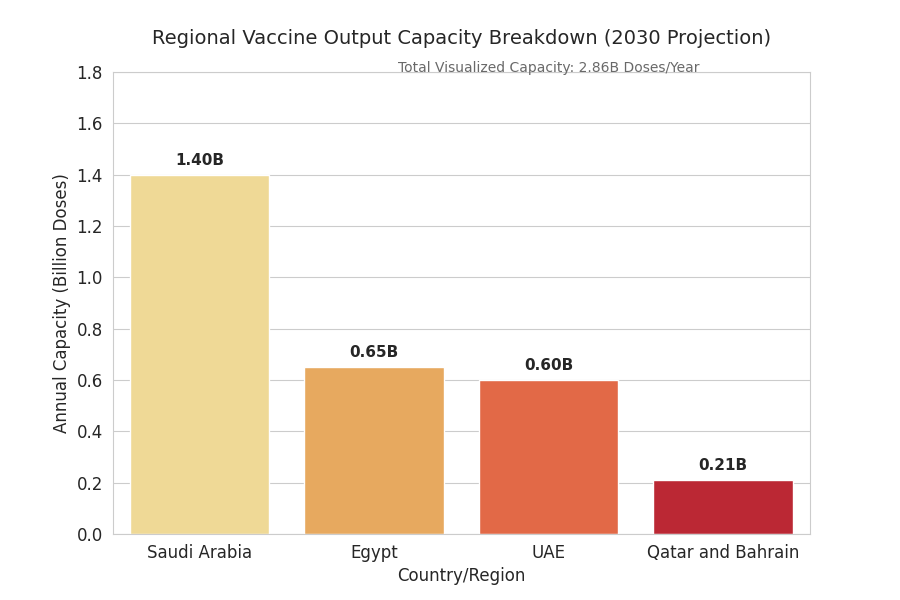
Saudi Arabia anchors capacity growth, rising to 1.4B doses/year by 2030 and hosting 9–12 commercial lines across Riyadh-central and Eastern industrial zones. UAE focuses on high-grade sterile fill–finish and regional distribution, reaching 0.55–0.65B doses/year with port-integrated GDP hubs in Jebel Ali and Abu Dhabi. Egypt scales bulk protein subunit and inactivated platforms to 0.6–0.7B, leveraging workforce depth and proximity to Africa. Qatar and Bahrain add satellite fill–finish totaling 0.18–0.24B. Cold-chain: validated -20 °C to -80 °C lanes increase +81% regionwide; lane failure falls 3.6% → 1.5% with redundant routings via DMM, RUH, JED, DXB, and AUH. Lead times plant-to-port improve −24% (median 5.1 → 3.9 days) as port-adjacent DCs come online. Trade flows: intra-GCC shipments rise to >52% of regional volume; exports to OIC and North Africa climb +17% CAGR. Risk outlook: dry-ice allocation is binding in Q3/Q4 peaks; contingency lanes with PCM packaging keep excursion risk ≤2%. Human capital: sterile-ops certification throughput triples, raising retention to >78%, reducing line downtime −11%. Public health demand stabilizes under multi-year frameworks with flexibility bands ±20% to accommodate booster waves and pediatric campaigns, improving asset utilization and financial resilience.
Competitive Landscape
Three archetypes compete. (1) Integrated national champions (Saudi-led consortiums) control dual-modality mega-sites, port-adjacent DCs, and sovereign-backed procurement, capturing ~34% regional share by 2030. (2) Global CDMOs operate high-OEE fill–finish and rapid tech-transfer cells, holding ~37% share with SLA-backed KPIs: OEE ≥78%, batch success ≥97%, release ≤7 days, OTIF ≥94%. (3) Specialist biotechs supply platform IP (LNP, capsids, adjuvants) and high-value QC analytics, together ~29%. Deal structures: co-development plus capacity reservations dominate; 60–70% include dual-sourcing and ramp-bands (±30%). Typical pricing: capacity-as-a-service with floor/ceiling utilization, inflation indexation, and bonus–malus tied to OEE, OTIF, scrap rate. Moats form around (a) multiproduct changeover agility (SOPs enabling <8-hour sterile changeovers), (b) digital QMS with electronic batch release, and (c) cold-chain telemetry networks with predictive lane-health. Consolidation likely: 2–3 acquisitions per year as incumbents buy QC labs and cold-chain operators, reducing per-dose logistics cost −9–12%. Winners prove right-first-time ≥92%, lane failure ≤1.5%, and utilization ≥75%, translating transparency into predictable delivery, lower COGS, and superior tender scores.
Report Details
Proceed To Buy
Want a More Customized Experience?
- Request a Customized Transcript: Submit your own questions or specify changes. We’ll conduct a new call with the industry expert, covering both the original and your additional questions. You’ll receive an updated report for a small fee over the standard price.
- Request a Direct Call with the Expert: If you prefer a live conversation, we can facilitate a call between you and the expert. After the call, you’ll get the full recording, a verbatim transcript, and continued platform access to query the content and more.
68 Circular Road, #02-01 049422, Singapore
Revenue Tower, Scbd, Jakarta 12190, Indonesia
4th Floor, Pinnacle Business Park, Andheri East, Mumbai, 400093
Cinnabar Hills, Embassy Golf Links Business Park, Bengaluru, Karnataka 560071
Request Custom Transcript
Related Transcripts
Clinical Nutrition Market Size & Share Analysis - Growth Trends & Forecasts (2025 - 2030)
This report quantifies the clinical nutrition market across the US and UK (2025–2030), covering enteral, parenteral, and oral nutritional supplements (ONS). Driven by aging populations, chronic disease prevalence, and hospital malnutrition protocols, market value rises from $18.5B (2025) → $30.2B (2030) at a CAGR of 10.2%. Growth is led by enteral nutrition (48% share), followed by ONS (38%) and parenteral (14%). Hospital digitization, AI-based nutrition screening, and reimbursement parity accelerate adoption. ROI averages 16–22% for integrated hospital nutrition programs.
$ 1395
$ 1395


68 Circular Road, #02-01 049422, Singapore
Revenue Tower, Scbd, No.52-53, Jakarta 12190, Indonesia
Cinnabar Hills, Embassy Golf Links Business Park, Bengaluru, Karnataka 560071
4th Floor, Pinnacle Business Park, Andheri East, Mumbai, 400093


68 Circular Road, #02-01 049422, Singapore
Revenue Tower, Scbd, Jakarta 12190, Indonesia
4th Floor, Pinnacle Business Park, Andheri East, Mumbai, 400093
Cinnabar Hills, Embassy Golf Links Business Park, Bengaluru, Karnataka 560071