

68 Circular Road, #02-01 049422, Singapore
Revenue Tower, Scbd, Jakarta 12190, Indonesia
4th Floor, Pinnacle Business Park, Andheri East, Mumbai, 400093
Cinnabar Hills, Embassy Golf Links Business Park, Bengaluru, Karnataka 560071


Connect With Us


68 Circular Road, #02-01 049422, Singapore
Revenue Tower, Scbd, Jakarta 12190, Indonesia
4th Floor, Pinnacle Business Park, Andheri East, Mumbai, 400093
Cinnabar Hills, Embassy Golf Links Business Park, Bengaluru, Karnataka 560071
Connect With Us
68 Circular Road, #02-01 049422, Singapore
Revenue Tower, Scbd, Jakarta 12190, Indonesia
4th Floor, Pinnacle Business Park, Andheri East, Mumbai, 400093
Cinnabar Hills, Embassy Golf Links Business Park, Bengaluru, Karnataka 560071
Request Custom Transcript
Floating Solar Panel and Hybrid Renewable Energy Technologies: Hydropower Reservoir Integration & Anti-Corrosion Strategies
From 2025 to 2030, floating photovoltaic (FPV) paired with hydropower will scale across China and Asia‑Pacific as utilities seek firm, low‑LCOE renewables without competing for scarce land. Co‑locating FPV on existing reservoirs taps shared interconnection, roads, and O&M, while hybrid controls use daytime PV to conserve water and nighttime hydro to deliver firm capacity, smoothing net load and reducing curtailment. China anchors the global buildout through gigawatt‑scale tenders and a deep balance‑of‑supply chain; India and Southeast Asia follow with large multipurpose reservoirs and peak‑demand growth. Japan and Korea contribute high‑reliability deployments on smaller reservoirs with advanced anti‑corrosion and mooring standards. Economics depend on three levers: (1) reservoir‑specific engineering (anchoring/mooring to cope with water‑level change, wind, and fetch); (2) electrical design (long DC cable runs, islet architectures, and wet‑rated connectors to cut losses and failure rates); and (3) durability coatings, encapsulants, and materials that resist UV, biofouling, and corrosion.
What's Covered?
Report Summary
Key Takeaways
1) Hybrid FPV‑hydro reduces curtailment and firming costs by sharing reservoirs and interconnection.
2) Reservoir engineering (moorings, fetch, water‑level delta) is the primary design risk to price correctly.
3) Electrical reliability (wet‑rated connectors, cable routing, GFD/monitoring) dominates O&M outcomes.
4) Corrosion/UV/biofouling defenses pay back via lower failure rates despite small CAPEX share.
5) Modular ‘islets’ and pre‑terminated harnesses speed installation and improve QA/QC.
6) Curtailment relief is a revenue lever hydro holds water while PV meets daytime peaks.
7) Bankability rises with verified wind‑wave models, salt‑spray tests, and accelerated aging data.
8) Contract for outcomes: availability, cable integrity KPIs, and corrosion‑resistance warranties.
Key Metrics
Market Size & Share
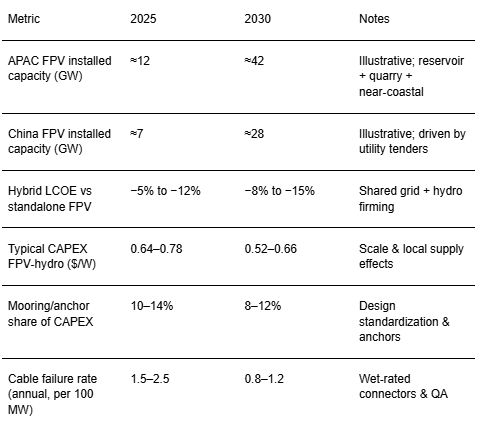
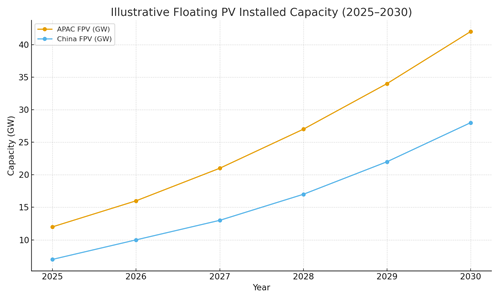
Asia‑Pacific hosts the world’s largest reservoir inventory and hydropower fleet, positioning the region to lead floating PV (FPV) adoption through 2030. Our illustrative trajectory shows APAC’s installed FPV capacity rising from ~12 GW in 2025 to ~42 GW by 2030, with China expanding from ~7 GW to ~28 GW as utilities standardize procurement and EPC playbooks. Early market share concentrates in provinces and countries with (i) large multipurpose reservoirs, (ii) existing hydropower interconnections sized for additional PV, and (iii) curtailment relief needs where hydro can shift energy to evening peaks. India, Indonesia, Thailand, and Vietnam add multi‑hundred‑MW projects as transmission corridors expand. Japan and Korea remain smaller in absolute terms but capture a premium share in high‑reliability deployments with advanced materials and safety standards.
FPV‑hydro hybrids enjoy structural cost advantages relative to greenfield PV: shared grid access, roads, and O&M teams reduce balance‑of‑system cost; hydro firming lowers curtailment, raising effective yield and capacity credit. Share growth also reflects siting pragmatism reservoir surfaces avoid land competition with agriculture and industry, and water shading reduces evaporative losses, an ancillary benefit in dry seasons. Constraints include water‑level variability, wind‑wave loading, and environmental buffers for navigation and fisheries, all of which require site‑specific engineering to maintain availability.
Looking ahead, market share should tilt toward standardized modular ‘islets’ that scale from 50‑MW to 500‑MW blocks, plus DC‑coupled designs that limit conversion losses. Where reservoirs sit near industrial load pockets, hybrids can supply on‑site or park‑level demand via private wires, further improving LCOE. China maintains the lead through supply‑chain depth and policy coordination, while Southeast Asia contributes the highest growth rates from a smaller base.
Market Analysis
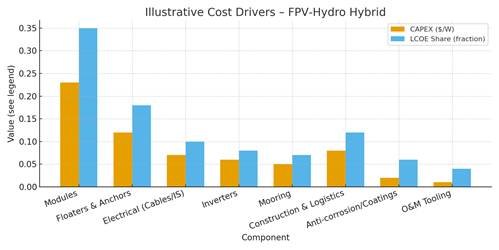
The FPV‑hydro cost stack is dominated by modules (~35% of LCOE) and float/anchor systems (~18%), followed by electrical balance of system and inverters. Illustrative CAPEX today ranges from $0.64–0.78/W for APAC hybrids, trending to $0.52–0.66/W by 2030 as float materials, anchors, and installation methods standardize. Mooring/anchoring design depends on bathymetry and hydro‑operating ranges; right‑sizing these elements avoids overdesign while preserving survivability under 50‑year wind‑wave events. Electrical reliability is the key OPEX lever: wet‑rated connectors, proper cable routing on hinged bridges, and granular ground‑fault detection reduce cable‑related outages by ~40–50% in mature sites.
Revenue and risk: hybrids increase effective yield by reducing curtailment and gaining capacity credits when hydro shifts water to evening peaks. Curtailment relief can add 2–5 percentage points to net capacity factor depending on grid conditions. Conversely, corrosion, biofouling, and UV degradation impose hidden costs if materials are under‑specified. Anti‑corrosion stacks marine‑grade alloys, anodization, fluoropolymer coatings, and sealed junction boxes carry a small CAPEX share (~6% of LCOE in our illustration) but protect high‑value cables and terminations. Contracts should embed availability guarantees, cable integrity KPIs, and corrosion‑resistance warranties with periodic inspection protocols and accelerated‑aging references.
By 2030, learning‑curve effects in float manufacturing, pre‑terminated harnesses, and rapid‑assembly islets are expected to compress construction durations by 20–30%. As more hybrids deploy power‑electronics for DC coupling and curtailment‑aware dispatch, LCOE declines further and financial structures (green bonds, IPP/JV models) broaden the investable pipeline.
Trends & Insights (2025–2030)
• DC‑coupled hybrids and advanced dispatch: plant‑level controllers co‑optimize PV output, hydro releases, and grid constraints to minimize curtailment.
• Modular ‘islet’ architectures: factory‑built floats with pre‑wired harnesses and hinged bridges reduce installation time and HSE exposure.
• Materials evolution: UV‑stabilized polymers, marine‑grade Al/Mg alloys, and fluoropolymer coatings extend asset life; sealed J‑boxes and gel‑filled connectors improve ingress protection.
• Reliability analytics: fiber‑optic temperature sensing on DC strings, ground‑fault localization, and drone/boat inspections enable predictive maintenance.
• Environmental stewardship: layouts that preserve navigation corridors and fish habitats; monitoring for water quality and glare; anti‑biofouling practices.
• Finance & insurance maturity: standardized EPC/O&M SLAs, parametric weather covers, and extended warranties enhance bankability.
• Workforce & safety: training for marine operations, lock‑out/tag‑out on water, and rescue protocols become standard owner requirements.
These trends converge on the same goal: higher availability at lower lifecycle cost. The most bankable portfolios tie materials and electrical reliability to measurable outcomes (availability, cable integrity, insulation resistance) rather than component checklists. As APAC utilities accumulate operating data, procurement shifts from bespoke designs to catalogued systems with verified wind‑wave and corrosion performance accelerating cycle times from tender to COD.
Segment Analysis (Buyer & Site Profiles)
• State Utilities & IPPs: pursue multi‑site reservoir portfolios with standardized islets; focus on LCOE, curtailment relief, and capacity credit. Grid access and dispatch rights with hydro owners are decisive.
• Industrial Parks & Mines: value private‑wire hybrids for price stability and ESG; prioritize rapid deployment and low‑maintenance designs.
• Municipal/Water Agencies: smaller reservoirs with water‑quality co‑benefits (reduced evaporation/algae); emphasize safety and public acceptance.
• Fishery/Multipurpose Reservoirs: require layouts preserving navigation and aquaculture; mooring plans must accommodate operations and seasonal water‑levels.
Site typologies:
1) Large deep reservoirs with significant drawdown: favor tensioned moorings, sliding bank anchors, and segmented arrays to manage water‑level swings.
2) Medium reservoirs with moderate fetch: catenary moorings and modular islets balance cost and survivability.
3) Small sheltered basins: simpler anchoring and higher density possible, with attention to water‑quality and recreation buffers.
Procurement guidance: bundle EPC with long‑term O&M, specify corrosion and electrical reliability KPIs, and require pre‑construction wind‑wave/hydrology studies. For multi‑site programs, framework agreements with float, mooring, and electrical suppliers compress costs and lead times. Owners should pre‑qualify vendors on salt‑spray tests, UV resistance, and wet‑rated connector systems, and include spares and replacement logistics in bids.
Geography Analysis (China & Asia‑Pacific)
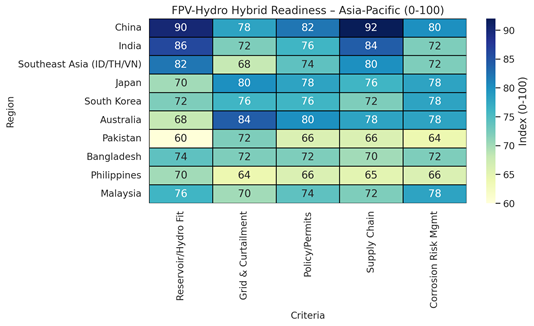
Readiness is highest in China given reservoir inventory, hydropower connectivity, and a deep FPV supply chain. Provincial programs align utility tenders, curtailment management, and transmission upgrades. India’s growth centers on state reservoirs and pumped‑storage synergies, though permitting and monsoon hydrology demand resilient moorings. Southeast Asia (Indonesia/Thailand/Vietnam) benefits from multipurpose reservoirs and rising peak demand; design must account for tropical storms and high biofouling pressure. Japan and Korea bring high‑reliability standards and advanced corrosion mitigation on smaller basins. Australia’s opportunities skew toward inland water bodies and hydropower assets with excellent grid conditions but harsher thermal cycles.
The decisive regional differentiators include (1) grid curtailment and the value of hydro‑firming; (2) permitting pathways across water authorities and fisheries; (3) local supply and marine contractors; and (4) corrosion/biofouling regimes that inform materials choice. Our readiness index highlights China at the top across reservoir fit and supply chain, with Japan/Korea leading in corrosion risk management maturity and Australia leading grid readiness. Countries with emerging programs (Pakistan, Bangladesh, Philippines) should prioritize pilot‑to‑program playbooks that de‑risk mooring and electrical interfaces before scaling.
Competitive Landscape (Ecosystem & Delivery Models)
The FPV‑hydro ecosystem spans float manufacturers, mooring/anchor specialists, module and inverter OEMs, EPC contractors, marine installers, and O&M platform providers. Differentiation hinges on (i) verified material durability (UV/corrosion), (ii) electrical reliability in wet environments, (iii) bankable mooring design, and (iv) delivery at scale with predictable QA/QC. China’s manufacturers lead on cost and volume; Japan/Korea vendors lead on materials and reliability features; Southeast Asian EPCs provide cost‑effective marine works.
Delivery models are converging on standardized ‘islet’ packages with pre‑terminated harnesses and modular moorings that scale from 10‑MW to 500‑MW blocks. Owners increasingly seek single‑point accountability EPC plus long‑term O&M with performance guarantees. Insurance markets favor projects with documented wind‑wave modeling, corrosion testing (e.g., ISO salt‑spray), and electrical protection schemes. Data‑enhanced O&M (string‑level monitoring, thermal drones, boat‑based IR scans) reduces downtime and supports availability guarantees.
As portfolios scale, consortiums pair low‑cost manufacturing with high‑reliability components for critical paths (connectors, junction boxes, coatings). Supply‑chain robustness including spares logistics and regional service hubs will become a winning criterion alongside price. Expect consolidation around platform vendors offering full stacks (float + mooring + electrical + O&M analytics) and IPP partnerships that replicate proven designs across reservoirs.
Report Details
Proceed To Buy
Want a More Customized Experience?
- Request a Customized Transcript: Submit your own questions or specify changes. We’ll conduct a new call with the industry expert, covering both the original and your additional questions. You’ll receive an updated report for a small fee over the standard price.
- Request a Direct Call with the Expert: If you prefer a live conversation, we can facilitate a call between you and the expert. After the call, you’ll get the full recording, a verbatim transcript, and continued platform access to query the content and more.
68 Circular Road, #02-01 049422, Singapore
Revenue Tower, Scbd, Jakarta 12190, Indonesia
4th Floor, Pinnacle Business Park, Andheri East, Mumbai, 400093
Cinnabar Hills, Embassy Golf Links Business Park, Bengaluru, Karnataka 560071
Request Custom Transcript
Related Transcripts


68 Circular Road, #02-01 049422, Singapore
Revenue Tower, Scbd, No.52-53, Jakarta 12190, Indonesia
Cinnabar Hills, Embassy Golf Links Business Park, Bengaluru, Karnataka 560071
4th Floor, Pinnacle Business Park, Andheri East, Mumbai, 400093


68 Circular Road, #02-01 049422, Singapore
Revenue Tower, Scbd, Jakarta 12190, Indonesia
4th Floor, Pinnacle Business Park, Andheri East, Mumbai, 400093
Cinnabar Hills, Embassy Golf Links Business Park, Bengaluru, Karnataka 560071