

68 Circular Road, #02-01 049422, Singapore
Revenue Tower, Scbd, Jakarta 12190, Indonesia
4th Floor, Pinnacle Business Park, Andheri East, Mumbai, 400093
Cinnabar Hills, Embassy Golf Links Business Park, Bengaluru, Karnataka 560071


Connect With Us


68 Circular Road, #02-01 049422, Singapore
Revenue Tower, Scbd, Jakarta 12190, Indonesia
4th Floor, Pinnacle Business Park, Andheri East, Mumbai, 400093
Cinnabar Hills, Embassy Golf Links Business Park, Bengaluru, Karnataka 560071
Connect With Us
68 Circular Road, #02-01 049422, Singapore
Revenue Tower, Scbd, Jakarta 12190, Indonesia
4th Floor, Pinnacle Business Park, Andheri East, Mumbai, 400093
Cinnabar Hills, Embassy Golf Links Business Park, Bengaluru, Karnataka 560071
Request Custom Transcript
Early-Stage Climate Tech VC Trends: Hydrogen & CCS Startup Valuation Models
From 2025 to 2030, early‑stage venture in North American hydrogen and CCS will migrate from proof‑of‑concept checks to scale‑up platforms that bridge into project finance. Hydrogen startups cluster around electrolyzer efficiency, balance‑of‑plant, storage/distribution, and demand‑side applications (HD mobility, ammonia, industrial heat). CCS/CCUS startups focus on capture modules (post‑combustion solvents/adsorbents), process intensification for SMR/blue H₂, CO₂ measurement and verification, and transport/storage enablement. Policy signals IRA 45V/45Q, DOE programs, state LCFS shape addressable markets and valuation narratives, while corporate offtake and hub infrastructure determine time‑to‑revenue. Valuation models in this cycle elevate ‘path‑to‑bankability’: investors price not only TAM and gross margins but also how credibly a startup can graduate into project‑financed assets (or enable them). Seed models lean on team quality, TRL, and de‑risked pilots; by Series A‑B, weighting shifts toward unit economics, standardized EPC interfaces, and revenue visibility via offtake/MoUs and service contracts.
What's Covered?
Report Summary
Key Takeaways
1) Valuations favor ‘path‑to‑bankability’ standardized modules, EPC interfaces, and offtake visibility.
2) Hydrogen: demand‑linked plays (mobility, ammonia, industrial heat) get premium if they show CI‑advantaged supply.
3) CCS: capture + MRV platforms with usage‑based pricing and field KPIs command recurring‑revenue multiples.
4) Policy durability and credit monetization drive time‑to‑revenue and downside protection.
5) Capital‑efficient pilots (modular skids, repeatable sites) compress burn and raise step‑ups.
6) Supplier alliances and OEM channels de‑risk scale; contract for outcomes (availability/CI).
7) Hybrid models (hardware + SaaS/services) smooth revenue and support better debt readiness.
8) Hub adjacency (Gulf Coast/Northeast/Canada) shortens the sales cycle and unlocks PF graduation.
Key Metrics

Market Size & Share
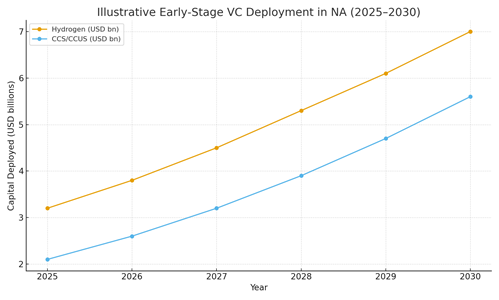
North American early‑stage VC for hydrogen and CCS is projected to expand as hub infrastructure, policy incentives, and corporate offtake de‑risk adoption. Our illustrative deployment curves show hydrogen rising from ~$3.2B to ~$7.0B and CCS from ~$2.1B to ~$5.6B by 2030. Share skews toward the U.S. Gulf Coast for CCS (storage access, industrial anchors) and to the West/Northeast for hydrogen technology and demand applications. Canada contributes meaningfully through storage geology, power mixes, and provincial programs.
Capital concentration will favor startups that can replicate pilots across customers, leverage OEM channels, and present credible graduation paths into project finance. Funds with operating partners and PF linkages will lead larger A‑B rounds; angel/seed networks catalyze pre‑seed/seed for novel chemistries and MRV.
Market Analysis
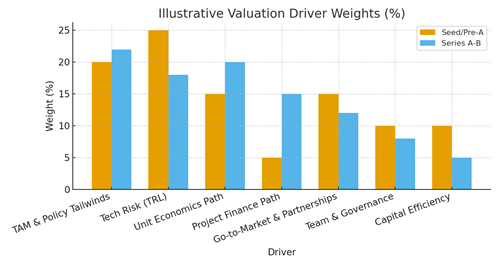
Valuation driver weights shift as companies mature. Seed rounds prioritize team, TRL, and TAM/policy, while Series A‑B investors emphasize unit‑economics, go‑to‑market, and project‑finance readiness. Our illustrative weighting shows technology risk declining as pilots are proven, while PF‑path weighting rises. For hydrogen, channel access to industrial offtakers and station developers improves revenue certainty; for CCS, integration with emitters and T&S partners reduces time‑to‑cash.
Modeling approaches: (1) blended multiple (EV/forward revenue + strategic premium); (2) risk‑adjusted DCF for platform plays with service revenue; (3) milestone‑based step‑up frameworks mapping TRL and offtake to pre‑money bands. Sensitivity analysis should capture policy changes, energy prices, and capture rates/uptime. In all cases, capital efficiency and repeatability (modules, sites) are key to valuation resilience.
Trends & Insights (2025–2030)
PF‑aware venture: VCs co‑structure pilots and offtake to tee up project finance; lenders explore ‘venture‑to‑PF’ bridges. Hardware‑plus: startups bundle software/MRV to create recurring revenue and higher gross margins. Policy indexing: offtake and service contracts increasingly index to policy/credit values to manage volatility. EPC‑ready packages: standardized interfaces and commissioning playbooks compress deployment timelines. Data advantage: operational datasets and digital twins underpin defensible moats and better underwriting. Strategic M&A: OEMs/utilities acquire to lock in supply chains and CI advantages.
Segment Analysis (Investor & Startup Profiles)
Seed/Pre‑seed: science‑heavy teams, lab pilots, grants; valuations lean on option value. Series A‑B: first commercial units, revenue pilots, OEM/EPC alliances; valuations reward unit economics and PF readiness. Corporate VCs/Strategics: prioritize integration value and supply assurance; often lead with joint development or purchase commitments. Startups: Hydrogen (electrolyzers BoP, storage, dispensing, industrial heat); CCS (modular capture, MRV software, CO₂ logistics services).
Geography Analysis (USA & North America)
Readiness hotspots include the U.S. Gulf Coast (industrial anchors, storage geology, hubs), the U.S. West (tech talent, mobility demand), and the Northeast (policy programs and customers). Canada’s Alberta/Ontario clusters add storage and industrial partners; Mexico’s northeast industrial belt emerges via cross‑border supply chains. Investors should prioritize hub‑adjacent sites for faster pilots and PF handoffs, while leveraging regional incentives and infrastructure to compress sales cycles.

Competitive Landscape (Ecosystem & Dealflow)
The ecosystem spans specialist climate funds, corporate venture arms, growth equity, federal and state programs, and hub‑aligned incubators. Differentiation for startups centers on (1) repeatable modules and EPC/PF readiness; (2) offtake visibility and policy monetization; (3) data/MRV moats; and (4) capital efficiency. For investors, edge comes from deep technical diligence, policy fluency, and partnerships with lenders/OEMs to accelerate graduation into project finance. Expect larger A‑B rounds for platform plays and strategic M&A as OEMs/utilities lock supply and CI advantages.
Report Details
Proceed To Buy
Want a More Customized Experience?
- Request a Customized Transcript: Submit your own questions or specify changes. We’ll conduct a new call with the industry expert, covering both the original and your additional questions. You’ll receive an updated report for a small fee over the standard price.
- Request a Direct Call with the Expert: If you prefer a live conversation, we can facilitate a call between you and the expert. After the call, you’ll get the full recording, a verbatim transcript, and continued platform access to query the content and more.
68 Circular Road, #02-01 049422, Singapore
Revenue Tower, Scbd, Jakarta 12190, Indonesia
4th Floor, Pinnacle Business Park, Andheri East, Mumbai, 400093
Cinnabar Hills, Embassy Golf Links Business Park, Bengaluru, Karnataka 560071
Request Custom Transcript
Related Transcripts
$ 1445

$ 1345
$ 1432

68 Circular Road, #02-01 049422, Singapore
Revenue Tower, Scbd, No.52-53, Jakarta 12190, Indonesia
Cinnabar Hills, Embassy Golf Links Business Park, Bengaluru, Karnataka 560071
4th Floor, Pinnacle Business Park, Andheri East, Mumbai, 400093


68 Circular Road, #02-01 049422, Singapore
Revenue Tower, Scbd, Jakarta 12190, Indonesia
4th Floor, Pinnacle Business Park, Andheri East, Mumbai, 400093
Cinnabar Hills, Embassy Golf Links Business Park, Bengaluru, Karnataka 560071