

68 Circular Road, #02-01 049422, Singapore
Revenue Tower, Scbd, Jakarta 12190, Indonesia
4th Floor, Pinnacle Business Park, Andheri East, Mumbai, 400093
Cinnabar Hills, Embassy Golf Links Business Park, Bengaluru, Karnataka 560071


Connect With Us


68 Circular Road, #02-01 049422, Singapore
Revenue Tower, Scbd, Jakarta 12190, Indonesia
4th Floor, Pinnacle Business Park, Andheri East, Mumbai, 400093
Cinnabar Hills, Embassy Golf Links Business Park, Bengaluru, Karnataka 560071
Connect With Us
68 Circular Road, #02-01 049422, Singapore
Revenue Tower, Scbd, Jakarta 12190, Indonesia
4th Floor, Pinnacle Business Park, Andheri East, Mumbai, 400093
Cinnabar Hills, Embassy Golf Links Business Park, Bengaluru, Karnataka 560071
Request Custom Transcript
D2C Acceleration in Europe: Margin Gains, CAC Trends & Fulfillment Cost Structures
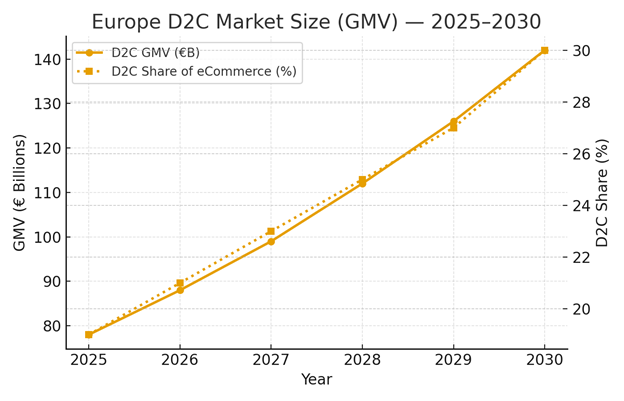
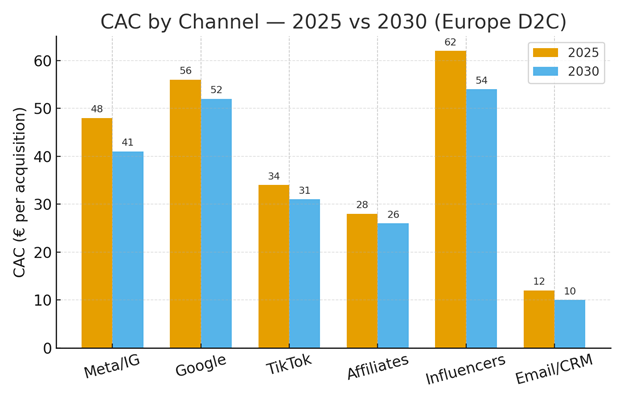
Europe’s direct-to-consumer (D2C) market is entering a scale-and-efficiency phase where profitable growth beats pure top-line expansion. From 2025 to 2030, we model D2C GMV rising from ~€78B to ~€142B (≈12.9% CAGR) as brands consolidate first-party data, accelerate owned-channel conversion, and re-architect fulfillment to reduce per-order costs. Margin expansion comes from three levers: (1) mix shift toward higher-contribution SKUs and subscription bundles; (2) CAC deflation through creative testing, MMM, and retail media diversification; and (3) ops productivity via zonal warehousing, delivery density, and returns prevention. CAC pressure normalizes as brands move beyond a duopoly mindset. By 2030, blended CAC declines ~15% vs. 2025, driven by incrementality testing, creator/affiliate programs, and CRM-led reactivation.

What's Covered?
Report Summary
Key Takeaways
1. Profitable growth era: GMV up ~€64B with margin discipline, not ad spend alone.
2. CAC re-bases lower on channel diversification, MMM, and creative iteration.
3. Gross margin +600 bps via mix, pricing science, and promo guardrails.
4. Fulfillment cost −20% from multi-node inventory and density-aware SLAs.
5. Returns −3.5 pp through fit guidance and content standards.
6. LTV/CAC expands to ~3.4× via subscriptions, memberships, replenishment.
7. DACH & UK/I lead absolute GMV; Southern Europe and CEE lead % growth.
8. Operating model edge beats brand hype: contribution-margin governance is decisive.
Key Metrics

Market Size & Share
Europe’s D2C channel scales from an estimated €78B in 2025 to €142B by 2030 (≈12.9% CAGR), with D2C’s share of total e-commerce expanding from ~19% to ~30%. Growth is fueled by first-party data compounding (higher match rates, richer propensity models), and CRM-led monetization that decouples revenue from volatile auction CPMs. Two structural tailwinds matter. First, retail media and creator/affiliate ecosystems provide incremental reach at lower CAC variance, especially when paired with MMM and geo-lift testing. Second, service-level rationalization prioritizing “fast enough” over “fastest” unlocks fulfillment savings without meaningful conversion drag beyond threshold SLAs. On the revenue side, AOV support comes from smarter bundling (add-ons, cross-category curation), price fences, and contribution-aware promotions. On cost lines, packaging right-sizing, zonal warehousing, and micro-fulfillment near dense postcodes reduce handling and last-mile kilometers. Returns decline as product pages integrate fit/size tools and richer UGC. D2C share expansion is most pronounced in categories with strong brand preference and replenishment (beauty, wellness, pet care), while specialty apparel benefits from better size guidance and post-purchase flows. The long-term constraint remains logistics wage inflation and urban congestion charges; however, density planning and OOH pickup adoption offset part of the pressure. Net: the channel exits 2030 with demonstrably higher contribution margins and more resilient demand capture than in the 2020–2023 period.
Market Analysis
The modeled CAC profile shows blended rates easing from ~€48 to ~€41 by 2030, with the steepest improvements in Meta/IG (creative iteration, short-form video testing), influencers (contract standardization, pay-for-performance), and e-mail/CRM (incremental wins from reactivation and win-back sequences). Google remains relatively high due to brand bidding and competitive generics, though MMM reveals pockets of positive incrementality in mid-funnel search. Affiliates sustain low volatility and favorable payback windows when guardrails prevent cannibalization of organic/branded traffic. The biggest driver of CAC discipline isn’t channel substitution alone—it’s creative ops: concept sprints, modular templates, and statistical holdouts that retire under-performing iterations quickly. We also see gains from landing-page velocity (TTFB/CDN), checkout friction removal (wallets, address-autocomplete), and zero-party data capture that drives personalized follow-ups. Crucially, D2C leaders attach CAC targets to contribution margin, not revenue, enabling smarter promo depth and shipping subsidies. This reframing prevents “cheap growth” traps where variable costs erase payback. By 2030, CAC variance narrows, enabling steadier media pacing and healthier cash cycles.
Trends & Insights
Three currents define 2025–2030. First, contribution-margin governance: brands gate discounts and shipping incentives behind SKU-level profit rules and enforce minimum CM by cohort. Second, logistics modularity: multi-node inventory blended with OOH pickup improves delivery density and lowers WISMO contacts, allowing a ~20% fulfillment cost reduction. Third, returns prevention: fit tech, 360° imagery, and pre-purchase Q&A reduce returns ~3.5 pp, with measurable savings in reverse logistics and refurbishing. Complementary trends include: (i) subscription primitives (refill calendars, member pricing, “skip/pause”) that lift LTV without heavy promos; (ii) retail media and creator marketplaces that diversify acquisition and insulate CAC; (iii) consented data expansion through quizzes and on-site tools that improve matching and lifecycle triggers; (iv) service-level realism (48-hour as default) that protects margin while keeping conversion stable; and (v) generative creative ops that multiply testing velocity. Risk factors: wage/fuel inflation in last-mile, stricter packaging/ESG rules, and signal loss in ad platforms—though MMM and server-side tagging partially offset. Net result: steadier payback and better EBITDA conversion from like-for-like revenue.
Segment Analysis
Performance bifurcates by category and customer segment. Beauty/personal care leads on gross margin and replenishment; top operators push contribution margins 400–700 bps above apparel via bundles and sampling. Specialty apparel improves profitability as size/fit tech slashes return risk among first-time buyers; VIP tiers and member-only drops sustain repeat rates. Home & lifestyle excels on basket composition (attach rate of accessories and care SKUs), though bulky shipping requires packaging right-sizing to avoid cost blow-outs. Health & wellness subscriptions (e.g., nutraceuticals) convert at higher LTV/CAC with churn inhibitors like cadence control and expert content. By customer segment, high-intent, content-engaged cohorts (email-captured, quiz-based) deliver 20–35% higher 6-month LTV than paid-social cold traffic. Geography-wise, DACH and UK&I anchor absolute revenue; Nordics and Benelux outperform on AOV and membership penetration; Southern Europe and CEE post faster growth from a smaller base. B2B2C (wholesale via marketplaces) remains a secondary lever for inventory turns, but true margin lift stems from D2C where brands control pricing, packaging, and experience.
Geography Analysis
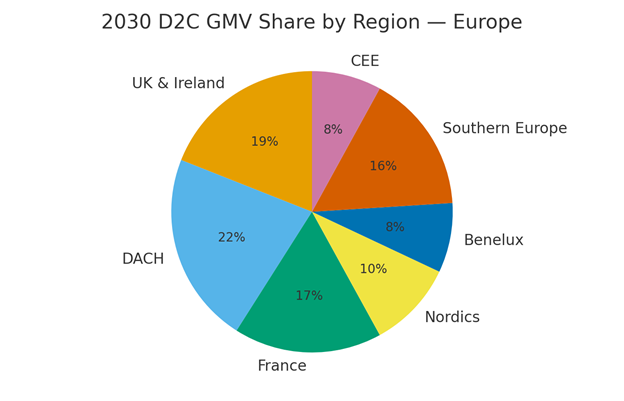
By 2030, we model D2C GMV distribution as: DACH (~22%), UK & Ireland (~19%), France (~17%), Southern Europe (~16%), Nordics (~10%), Benelux (~8%), and CEE (~8%). DACH benefits from high online penetration and operational rigor (multi-node networks, parcel lockers), while the UK leverages mature retail media ecosystems and high wallet adoption for friction-light checkout. France sustains balanced growth through strong national brands and a tightening of returns policies that protect margins. Southern Europe’s share rises on logistics modernization (regional hubs, OOH pickup) and social-commerce adoption; CEE’s growth outpaces the average but off a smaller base, helped by cross-border enablement and improving payments coverage. Nordics and Benelux punch above their weight in AOV and subscription uptake, aided by high trust in locker networks and strong digital ID/wallet penetration. For network planning, brands should stage expansion by combining demand-density maps with carrier SLAs and pickup-point coverage, then phase inventory nodes as cohorts mature. Contribution-aware regional pricing (VAT, duties, fuel surcharges) remains essential to maintain target margins.
Competitive Landscape
The competitive frontier rewards operating-model excellence more than storytelling. Leaders share traits: a clear CAC stack (channel incrementality + creative testing cadence), contribution-margin guardrails embedded in promo and shipping logic, and modular fulfillment with OOH options to stabilize last-mile costs. They maintain disciplined SKU architectures (few, high-contribution hero SKUs + curated add-ons) and lean into memberships to monetize loyalty without permanent discounting. Challenger brands win by niching into high-affinity communities and exploiting creator collaborations with transparent rev-share. Aggregators/platforms continue to provide low-capex scale but compress brand margins; hence, hybrid strategies keep a D2C core for data/experience while using marketplaces tactically for new-to-brand reach and inventory turns. Enablers (3PLs, lockers, retail media networks, creator marketplaces, payments wallets, returns tech) co-evolve to offer tighter SLAs and better attribution, lowering CAC variance and cost-to-serve. M&A likely centers on capability buys (creative ops, data, logistics tech) rather than pure brand roll-ups. The durable advantage: a closed-loop system where product, media, pricing, and logistics are governed by contribution margin and cohort LTV—not vanity growth.
Report Details
Proceed To Buy
Want a More Customized Experience?
- Request a Customized Transcript: Submit your own questions or specify changes. We’ll conduct a new call with the industry expert, covering both the original and your additional questions. You’ll receive an updated report for a small fee over the standard price.
- Request a Direct Call with the Expert: If you prefer a live conversation, we can facilitate a call between you and the expert. After the call, you’ll get the full recording, a verbatim transcript, and continued platform access to query the content and more.
68 Circular Road, #02-01 049422, Singapore
Revenue Tower, Scbd, Jakarta 12190, Indonesia
4th Floor, Pinnacle Business Park, Andheri East, Mumbai, 400093
Cinnabar Hills, Embassy Golf Links Business Park, Bengaluru, Karnataka 560071
Request Custom Transcript
Related Transcripts


68 Circular Road, #02-01 049422, Singapore
Revenue Tower, Scbd, No.52-53, Jakarta 12190, Indonesia
Cinnabar Hills, Embassy Golf Links Business Park, Bengaluru, Karnataka 560071
4th Floor, Pinnacle Business Park, Andheri East, Mumbai, 400093


68 Circular Road, #02-01 049422, Singapore
Revenue Tower, Scbd, Jakarta 12190, Indonesia
4th Floor, Pinnacle Business Park, Andheri East, Mumbai, 400093
Cinnabar Hills, Embassy Golf Links Business Park, Bengaluru, Karnataka 560071