

68 Circular Road, #02-01 049422, Singapore
Revenue Tower, Scbd, Jakarta 12190, Indonesia
4th Floor, Pinnacle Business Park, Andheri East, Mumbai, 400093
Cinnabar Hills, Embassy Golf Links Business Park, Bengaluru, Karnataka 560071


Connect With Us


68 Circular Road, #02-01 049422, Singapore
Revenue Tower, Scbd, Jakarta 12190, Indonesia
4th Floor, Pinnacle Business Park, Andheri East, Mumbai, 400093
Cinnabar Hills, Embassy Golf Links Business Park, Bengaluru, Karnataka 560071
Connect With Us
68 Circular Road, #02-01 049422, Singapore
Revenue Tower, Scbd, Jakarta 12190, Indonesia
4th Floor, Pinnacle Business Park, Andheri East, Mumbai, 400093
Cinnabar Hills, Embassy Golf Links Business Park, Bengaluru, Karnataka 560071
Request Custom Transcript
Blue Hydrogen Project Economics: Carbon Capture and Storage (CCS) Integration & Carbon Credit Stacking Strategies
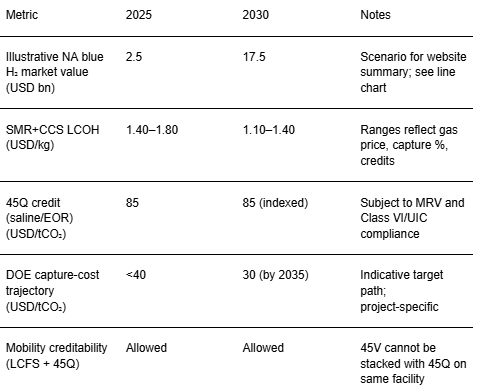
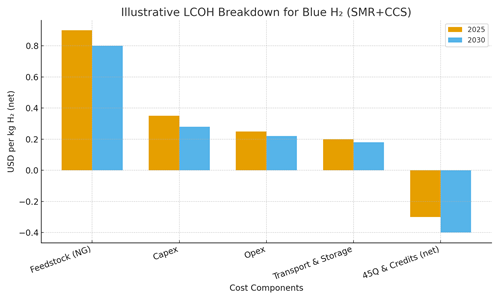
Blue hydrogen natural-gas–derived hydrogen paired with carbon capture and storage (CCS)is poised to scale across the USA and North America through 2030, supported by strong policy signals, emerging hydrogen hubs, and anchor demand from refining, ammonia, and heavy-industry users. With 45Q credits at $85 per metric ton CO₂ for secure geologic storage, project netbacks improve materially wherever transport and storage infrastructure are in place. In parallel, demand-side programs and regional hydrogen hubs are accelerating offtake formation and common infrastructure, reducing counterparty and execution risk for first-wave projects. At plant level, SMR+CCS remains the lowest-cost blue-H₂ pathway in North America. Illustrative modeled economics show LCOH moving from roughly $1.40–$1.80/kg in 2025 toward $1.10–$1.40/kg by 2030 at advantaged sites, driven by incremental capex learning, capture-cost reductions, higher utilization, and credit monetization.
What's Covered?
Report Summary
Key Takeaways
1) 45Q at $85/tCO₂ is the cornerstone revenue lever for blue-H₂ + CCS; eligibility depends on MRV and secure storage.
2) H2Hub programs de-risk offtake and infrastructure, concentrating early bankable projects in corridor regions.
3) SMR+CCS is the leading-cost pathway today; coal+CCS is generally less competitive in North America.
4) Capture-cost learning (solvents/adsorbents, compression, integration) tightens LCOH through 2030.
5) 45Q can co-exist with LCFS for transport use cases; 45V cannot be stacked with 45Q on the same facility.
6) Bankability hinges on methane-intensity control, ≥90% capture, and proximity to Class VI storage sites.
7) Best-fit regions combine low-cost gas, storage geology, and anchor industrial demand (Gulf Coast, select Canada).
8) Contracts with floor-price mechanics (for CI-linked revenues) and take-or-pay CO₂ tariffs stabilize cash flows.
Key Metrics
Market Size & Share
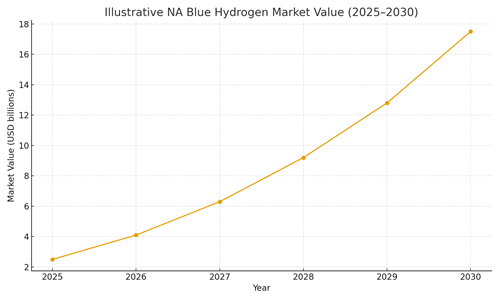
North America’s blue-hydrogen market is projected to expand rapidly from 2025 to 2030 as first-wave hub projects reach FID and early offtake is secured. Using conservative, illustrative assumptions aligned with current incentives (45Q at $85/tCO₂; LCFS creditability for transport use; staged hub ramp-up), the modeled regional market value rises from roughly $2.5 billion in 2025 to approximately $17.5 billion by 2030, implying a compound growth rate close to the high 40% range. Growth will not be uniform. The U.S. Gulf Coast is expected to lead with more than 35% share by 2030 due to low-cost gas, CO₂ pipeline rights-of-way, abundant saline storage, and dense refinery/ammonia demand. The Midwest/Heartland and Mid-Atlantic follow, anchored by H2Hub initiatives and favorable storage geology. Canada contributes meaningfully where storage and industrial demand coincide. California and parts of the West contribute a smaller share initially but offer elevated netbacks for mobility via LCFS.
Share dynamics are governed by (1) CO₂ transport & storage readiness (Class VI approvals, pore-space access, MRV), (2) gas pricing and methane intensity (certified gas, LDAR programs), and (3) credit monetization strategy. Where LCFS pathways are accessible, transport use improves realized pricing per kilogram. Note: 45Q and 45V cannot be stacked on the same facility; blue-H₂ projects typically claim 45Q, while LCFS can co-exist for transport-fuel pathways. By application, 2030 demand shares are led by refining and ammonia (50–55%), followed by heavy-duty mobility pilots (15–20%), industrial heat/steel (10–15%), power/co-firing (5–10%), and other uses (<10%). As hub logistics mature and station networks expand, the mobility share can rise, provided CI-linked programs and OEM deployments scale. Supply growth remains sensitive to capture rates (≥90%), storage proximity (<200 km preferred), and permitting timelines (12–24+ months for Class VI). Developers with advantaged locations, pipeline tie-ins, and anchor offtake should achieve earlier market share and more resilient unit economics.
Market Analysis
Plant-level economics are primarily driven by natural gas feedstock and capture-related costs. Our illustrative LCOH shows net costs moving from about $1.40/kg in 2025 toward $1.10–$1.20/kg by 2030 at advantaged sites after credits, consistent with peer benchmarks near ~$1.6/kg baseline for SMR+CCS prior to location-specific credits. The capture-cost learning curve (solvent/adsorbent improvements, process integration, lower energy penalty) and higher utilization drive most of the reduction, while capital cost learning and supply-chain maturation contribute incrementally. 45Q at $85/tCO₂ materially improves netbacks per kilogram when capture rates reach 90–95% and CO₂ transport/storage are in place. For transport pathways, LCFS credits can be layered on CI scores to boost realized pricing; however, 45V and 45Q cannot be combined on the same facility, pushing blue-H₂ projects to optimize for 45Q while leveraging LCFS where applicable.
Regional cost spread emerges across four patterns: (1) Gulf Coast: lowest delivered LCOH given pipeline CO₂, proximate storage, and anchor industrial loads; (2) Midwest/Heartland: competitive where storage is proximal and ag-chem demand is strong; (3) West/California: higher gas and compliance costs offset by LCFS for mobility; (4) Canada: strong storage geology and industrial anchors with province-level policy variation. Key risk controls include methane-intensity management via certified gas and LDAR, capture-plant reliability, compression power budgeting, and robust CO₂ contract structures (take-or-pay, tariff indexation). Bankability improves with floor-price mechanics on CI-linked revenues, longer-tenor offtakes, and synchronized hydrogen and CO₂ logistics.
Trends & Insights
Policy-anchored bankability persists: 45Q remains the anchor incentive, and begin-construction timing governs credit windows and underwriting confidence. Hub-centric clustering accelerates shared infrastructure, lowering unit costs and counterparty risk. Capture-cost down-curves benefit from DOE-backed R&D and commercial scaling. Lifecycle scrutiny intensifies buyers increasingly evaluate carbon intensity and methane leakage, pushing developers toward certified gas, rigorous LDAR, and ≥90% capture. Credit monetization becomes more sophisticated: 45Q combined with LCFS for eligible transport use, while avoiding 45V conflicts. Third-party CO₂ storage developers rise in importance as project partners, offering bankable Class VI pathways. End-use diversification continues: refining and ammonia dominate early volumes; mobility grows with station deployment; steel and high-grade industrial heat expand through pilots. Public optics around CCS improve as large projects demonstrate feasibility, but permitting and stakeholder engagement remain critical gating items. Overall, the learnings from first-wave projects are expected to cascade into standardized contract terms, lower execution risk, and tighter LCOH ranges by 2030.
Segment Analysis
Refining & Chemicals (Ammonia): Largest near-term sink; blue hydrogen displaces gray in hydro processing and feeds low-carbon ammonia. Continuous load profiles and on-site integration enable strong utilization and attractive unit economics. Heavy-Duty Transport: Initially niche but strategically important where LCFS and OEM deployments align; total cost of ownership depends on dispenser price, station capex utilization, and CI-linked revenue stacking. Steel & Industrial Heat: Pilot-to-demo uptake through 2030; hydrogen competes with electrification depending on local power prices and process heat requirements. Power/Peaking: Limited near-term contribution; co-firing pilots emerge where pipeline supply is assured and flexibility is valued. Fertilizer/Ag: Blue-ammonia export potential from Gulf Coast/Canada where storage is abundant and port logistics are favorable.
Indicative 2030 demand split: Refining & ammonia 50–55%; heavy mobility 15–20%; industrial heat/steel 10–15%; power 5–10%; other <10%. Buyers should map segment exposure to regional policy (e.g., LCFS), proximity to hubs, and CI requirements in long-term supply agreements. Developers with dual-path strategies (industrial anchor + mobility pilots) can diversify revenue and accelerate learning-by-doing.
Geography Analysis
A readiness index (0–100) across North American subregions indicates near-term leadership for the U.S. Gulf Coast, followed by the Midwest/Heartland and select Canadian clusters. Scores reflect Resource Access, CO₂ Storage Capacity, Policy Incentives, and Industrial Demand. Gulf Coast advantages include low-cost gas, extensive pipeline corridors, favorable pore space, and dense refinery/ammonia loads. The Midwest/Heartland benefits from storage geology and ag-chem demand; the West features LCFS upside for mobility despite higher costs; the Northeast shows improving policy signals but must rely on third-party storage; Canada offers excellent geology and strong industrial anchors with provincial variation. Permitting and MRV readiness are gating factors across regions, and developers should plan Class VI timelines into COD and financing schedules. As hub logistics mature, corridor-based infrastructure is expected to reduce transport and storage tariffs and compress LCOH dispersion across regions.

Competitive Landscape
Developers and owners include integrated energy companies, independent chemicals/power developers, and midstream CO₂ specialists. Capture suppliers compete on energy penalty, solvent stability, and footprint, while membranes/adsorption offer pathway-specific advantages. Transport and storage players (pipeline operators and dedicated storage developers) are pivotal long-term take-or-pay tariffs and third-party Class VI solutions are becoming standard bankability features. Offtakers span refiners, ammonia producers, and logistics/mobility firms with CI-linked revenue exposure. Competitive differentiation hinges on siting (gas cost, storage proximity), high capture rates, permitting velocity, and credit monetization sophistication (45Q + LCFS where applicable). Blue vs Green: electrolyzer incentives and 45V will expand green H₂ in renewables- or nuclear-rich regions; however, where gas is competitive and storage is superior, blue H₂ maintains an advantage to 2030. Watch-list signals include: (1) Class VI permit issuances and MRV approvals; (2) LCFS pricing; (3) H2Hub MOUs converting to binding contracts; (4) capture-cost progress vs. targets; and (5) policy stability on begin-construction deadlines. First movers that secure advantaged sites, offtakers, and storage pathways are positioned to scale portfolios and lower cost of capital.
Report Details
Proceed To Buy
Want a More Customized Experience?
- Request a Customized Transcript: Submit your own questions or specify changes. We’ll conduct a new call with the industry expert, covering both the original and your additional questions. You’ll receive an updated report for a small fee over the standard price.
- Request a Direct Call with the Expert: If you prefer a live conversation, we can facilitate a call between you and the expert. After the call, you’ll get the full recording, a verbatim transcript, and continued platform access to query the content and more.
68 Circular Road, #02-01 049422, Singapore
Revenue Tower, Scbd, Jakarta 12190, Indonesia
4th Floor, Pinnacle Business Park, Andheri East, Mumbai, 400093
Cinnabar Hills, Embassy Golf Links Business Park, Bengaluru, Karnataka 560071
Request Custom Transcript
Related Transcripts
$ 1445

$ 1345
$ 1432

68 Circular Road, #02-01 049422, Singapore
Revenue Tower, Scbd, No.52-53, Jakarta 12190, Indonesia
Cinnabar Hills, Embassy Golf Links Business Park, Bengaluru, Karnataka 560071
4th Floor, Pinnacle Business Park, Andheri East, Mumbai, 400093


68 Circular Road, #02-01 049422, Singapore
Revenue Tower, Scbd, Jakarta 12190, Indonesia
4th Floor, Pinnacle Business Park, Andheri East, Mumbai, 400093
Cinnabar Hills, Embassy Golf Links Business Park, Bengaluru, Karnataka 560071