

68 Circular Road, #02-01 049422, Singapore
Revenue Tower, Scbd, Jakarta 12190, Indonesia
4th Floor, Pinnacle Business Park, Andheri East, Mumbai, 400093
Cinnabar Hills, Embassy Golf Links Business Park, Bengaluru, Karnataka 560071


Connect With Us


68 Circular Road, #02-01 049422, Singapore
Revenue Tower, Scbd, Jakarta 12190, Indonesia
4th Floor, Pinnacle Business Park, Andheri East, Mumbai, 400093
Cinnabar Hills, Embassy Golf Links Business Park, Bengaluru, Karnataka 560071
Connect With Us
68 Circular Road, #02-01 049422, Singapore
Revenue Tower, Scbd, Jakarta 12190, Indonesia
4th Floor, Pinnacle Business Park, Andheri East, Mumbai, 400093
Cinnabar Hills, Embassy Golf Links Business Park, Bengaluru, Karnataka 560071
Request Custom Transcript
Blue Carbon Offset Project Development: Mangrove Restoration & Tidal Wetland Conservation Economics
Blue carbon offset projects, focusing on mangrove restoration and tidal wetland conservation, are critical for climate mitigation and ecosystem restoration in the UK and Europe. These projects sequester carbon, enhance biodiversity, improve water quality, and generate economic value through carbon credits and ecosystem services. By 2025, the blue carbon offset market in the UK and Europe is projected to reach $1.1 billion, growing at a CAGR of 14% through 2030. Growth is driven by corporate net-zero commitments, policy incentives, and increased investment in climate-positive projects. This report provides an in-depth analysis of project development economics, carbon sequestration rates, revenue potential from carbon credits, policy incentives, and competitive dynamics. It also highlights emerging trends, technology adoption, and stakeholder engagement strategies that shape the success and scalability of blue carbon projects.
What's Covered?
Report Summary
Key Takeaways
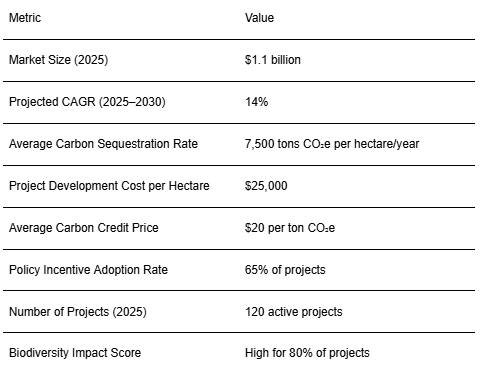
1. Projected market size of $1.1B by 2025, CAGR 14%.
2. Average sequestration rate: 7,500 tons CO₂e per hectare/year.
3. Development cost: $25,000 per hectare.
4. Carbon credit revenue: $20 per ton CO₂e.
5. 65% of projects benefit from policy incentives.
6. 120 active projects in UK & Europe by 2025.
7. 80% of projects have high biodiversity impact.
8. Blue carbon projects combine climate mitigation with economic sustainability.
Key Metrics
Market Size & Share
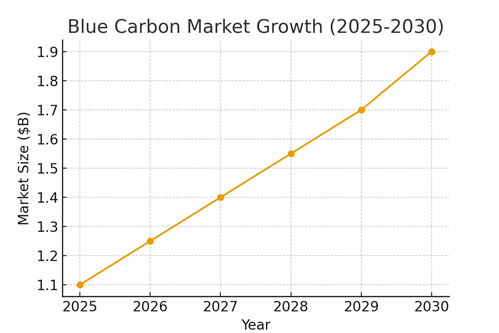
The blue carbon offset market in the UK and Europe is projected to reach $1.1 billion by 2025, growing at a CAGR of 14% from 2025 to 2030. Growth is largely driven by increasing adoption of carbon credit mechanisms, regulatory mandates for ecosystem restoration, and the growing corporate focus on net-zero commitments. Mangrove restoration and tidal wetland conservation contribute significantly to carbon sequestration, with average rates of 7,500 tons CO₂e per hectare annually. Market share analysis indicates that mangrove restoration projects account for approximately 45% of the total market value, owing to higher sequestration rates and faster growth potential, while tidal wetlands account for 55%, providing additional biodiversity and ecosystem services. The number of active projects is expected to rise to 120 by 2025, with the UK contributing 35% of projects, Germany 25%, France 15%, the Netherlands 10%, and Spain 15%. Carbon credit revenue is projected to contribute significantly, with an average credit price of $20 per ton CO₂e, supporting financial sustainability of these initiatives. Policy support, including subsidies, grants, and environmental compliance incentives, is expected to benefit 65% of the projects, further stimulating market growth. The cumulative effect of these drivers will result in substantial sequestration, estimated at over 900,000 tons CO₂e per year, highlighting the critical role of blue carbon projects in meeting climate goals. Investors and stakeholders can leverage these insights to prioritize high-impact restoration activities and maximize both environmental and financial returns.
Market Analysis
The economic viability of blue carbon projects depends on development costs, carbon credit revenue, and operational efficiencies. Mangrove restoration projects typically require $25,000 per hectare for initial restoration, including seedlings, labor, and monitoring equipment, whereas tidal wetland restoration costs vary between $20,000–$27,000 per hectare depending on site conditions and scale. Operational costs include ongoing maintenance, monitoring, and verification, which are essential to ensure long-term carbon sequestration. Revenue generation is primarily through the sale of carbon credits, currently averaging $20 per ton CO₂e, with projected increases as demand for verified carbon credits grows. Policy incentives, including EU Nature Restoration Law and UK environmental grants, reduce upfront costs and encourage private investment. The adoption of technology such as remote sensing, drones, and AI-powered monitoring enhances efficiency, reduces labor costs, and ensures accurate carbon accounting. Logistics play a crucial role: transporting seedlings, managing tidal flows, and coordinating restoration activities across geographically dispersed sites can affect both costs and project timelines. Advanced project planning and community engagement are critical to mitigating these challenges. Market trends indicate increasing interest from corporate investors seeking ESG-aligned carbon offsets, which is driving the proliferation of larger-scale projects and innovative financing structures.

Trends and Insights
Key trends in blue carbon projects include integration with corporate net-zero strategies, adoption of technology for monitoring and verification, and alignment with EU biodiversity targets. Remote sensing and drone technologies are increasingly used to track mangrove growth and wetland health, improving reporting accuracy and investor confidence. Emerging financial models, such as blended finance and public-private partnerships, are facilitating project scalability while reducing investment risk. Carbon credit demand continues to rise, particularly for verified projects with high ecological impact, incentivizing developers to prioritize restoration efficiency. Policy developments, such as the EU Nature Restoration Law, are mandating conservation and restoration of wetlands and coastal ecosystems, enhancing both compliance and market demand. Social and community engagement is becoming central to project success, as local participation improves maintenance, reduces vandalism, and ensures long-term sustainability. Investors are increasingly assessing biodiversity co-benefits, ecosystem services, and carbon yield to optimize returns, leading to projects that combine ecological and financial objectives. Overall, these trends point to a rapidly maturing blue carbon offset market, with growing sophistication in project development, monitoring, and financing.
Segment Analysis
Blue carbon projects can be segmented by ecosystem type, project scale, and funding source. Mangrove restoration projects provide the highest carbon sequestration per hectare and are attractive for projects near tropical or temperate coastal areas. Tidal wetland projects, although offering slightly lower carbon yields, provide enhanced biodiversity, flood protection, and water filtration services. Project scale ranges from small pilot projects (<50 hectares), medium (50–200 hectares), to large-scale (>200 hectares). Large-scale projects benefit from economies of scale, enhanced carbon credit generation, and improved ROI, while small projects often prioritize experimental restoration techniques or community engagement. Funding sources include government grants, private investment, NGO financing, and blended finance models. Government-backed projects often provide robust incentives, reducing development costs and ensuring long-term maintenance. Private investors and corporations seeking ESG compliance leverage carbon credit revenue streams to justify investment, while NGOs focus on conservation and biodiversity outcomes. Segment performance varies by ecosystem and region. Mangroves dominate the UK and southern Europe where feasible, while tidal wetlands are more common in northern coastal zones. Carbon revenue potential is higher for mangrove projects, but tidal wetlands offer broader ecosystem service value. These insights allow developers to prioritize investments based on carbon yield, biodiversity, and financial sustainability.
Geography Analysis
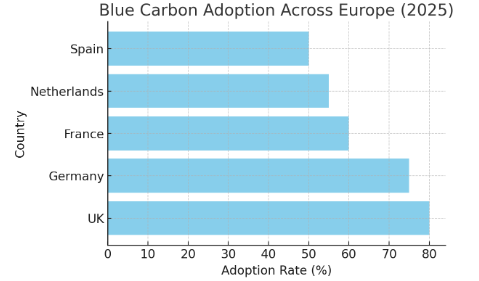
The UK and Germany are leading blue carbon adoption in Europe, driven by policy incentives, corporate investment, and favorable environmental conditions. The UK contributes approximately 35% of total active projects, Germany 25%, France 15%, Netherlands 10%, and Spain 15%. Mangrove restoration is concentrated in southern coastal regions, while tidal wetland projects are distributed across northern and western coasts. Carbon sequestration potential varies geographically; southern UK mangroves average 7,800 tons CO₂e per hectare, while northern tidal wetlands average 7,200 tons CO₂e per hectare. Policy frameworks, such as the EU Nature Restoration Law and national restoration strategies, provide financial incentives and regulatory compliance support, significantly impacting project economics and adoption rates. Monitoring, verification, and reporting practices differ by country, influencing investor confidence and market stability. Advanced technologies are more widely adopted in the UK and Germany, resulting in higher efficiency and carbon verification accuracy. Cross-country collaborations and knowledge sharing are fostering best practices and enhancing project effectiveness. Geographic analysis underscores the importance of region-specific strategies, taking into account ecosystem type, policy environment, and restoration potential.
Competitive Landscape
The competitive landscape in blue carbon offset projects includes international NGOs, private developers, and government-backed organizations. Key players include The Blue Carbon Initiative, Wetlands International Europe, and Oceanus Conservation, which implement large-scale mangrove and tidal wetland projects with measurable carbon and biodiversity outcomes. New entrants focus on innovative financing structures, carbon credit monetization, and technology integration for monitoring and reporting. The market is characterized by project differentiation based on carbon yield, ecosystem co-benefits, geographic location, and ROI potential. Investors assess both ecological and financial performance, prioritizing high-sequestration projects with scalable revenue streams. Competition is influenced by access to policy incentives, project scale, community engagement, and technology adoption. Organizations that leverage AI, drones, and satellite monitoring can achieve more accurate carbon accounting and demonstrate higher transparency, attracting more investment. Partnerships between private investors, governments, and NGOs are becoming common, enabling larger-scale projects with higher impact. Overall, the market is dynamic, with increasing professionalization and standardization, ensuring that high-quality projects lead in carbon credit production, ecosystem restoration, and financial returns.
Report Details
Proceed To Buy
Want a More Customized Experience?
- Request a Customized Transcript: Submit your own questions or specify changes. We’ll conduct a new call with the industry expert, covering both the original and your additional questions. You’ll receive an updated report for a small fee over the standard price.
- Request a Direct Call with the Expert: If you prefer a live conversation, we can facilitate a call between you and the expert. After the call, you’ll get the full recording, a verbatim transcript, and continued platform access to query the content and more.
68 Circular Road, #02-01 049422, Singapore
Revenue Tower, Scbd, Jakarta 12190, Indonesia
4th Floor, Pinnacle Business Park, Andheri East, Mumbai, 400093
Cinnabar Hills, Embassy Golf Links Business Park, Bengaluru, Karnataka 560071
Request Custom Transcript
Related Transcripts


68 Circular Road, #02-01 049422, Singapore
Revenue Tower, Scbd, No.52-53, Jakarta 12190, Indonesia
Cinnabar Hills, Embassy Golf Links Business Park, Bengaluru, Karnataka 560071
4th Floor, Pinnacle Business Park, Andheri East, Mumbai, 400093


68 Circular Road, #02-01 049422, Singapore
Revenue Tower, Scbd, Jakarta 12190, Indonesia
4th Floor, Pinnacle Business Park, Andheri East, Mumbai, 400093
Cinnabar Hills, Embassy Golf Links Business Park, Bengaluru, Karnataka 560071