

68 Circular Road, #02-01 049422, Singapore
Revenue Tower, Scbd, Jakarta 12190, Indonesia
4th Floor, Pinnacle Business Park, Andheri East, Mumbai, 400093
Cinnabar Hills, Embassy Golf Links Business Park, Bengaluru, Karnataka 560071


Connect With Us


68 Circular Road, #02-01 049422, Singapore
Revenue Tower, Scbd, Jakarta 12190, Indonesia
4th Floor, Pinnacle Business Park, Andheri East, Mumbai, 400093
Cinnabar Hills, Embassy Golf Links Business Park, Bengaluru, Karnataka 560071
Connect With Us
68 Circular Road, #02-01 049422, Singapore
Revenue Tower, Scbd, Jakarta 12190, Indonesia
4th Floor, Pinnacle Business Park, Andheri East, Mumbai, 400093
Cinnabar Hills, Embassy Golf Links Business Park, Bengaluru, Karnataka 560071
Request Custom Transcript
AI-Powered Climate Catastrophe Modelling in Insurance: Post-2024 EU ESG Mandate Adoption (2025–2030)
The insurance industry is evolving with the convergence of climate change, regulatory pressures, and AI advancements. The 2024 EU ESG mandate will reshape climate catastrophe modeling in Europe from 2025 to 2030. AI technologies, such as machine learning and predictive analytics, provide insurers with more accurate climate risk assessments, improving underwriting, pricing, and claims management. The report explores AI adoption, market trends, and regulatory impacts, highlighting how AI can drive innovation, compliance, and sustainability. By 2030, AI-powered models are expected to become the industry standard, guiding insurers in adapting their business models.

What's Covered?
Report Summary
Key Takeaways
- - AI-powered climate catastrophe modelling will be integral to the insurance industry's shift towards more sustainable, data-driven risk management.
- - The 2024 EU ESG mandates are driving insurers to adopt AI solutions for climate risk analysis and compliance.
- - AI enhances the accuracy of catastrophe predictions, helping insurers mitigate potential losses and improve underwriting practices.
- - AI automates climate catastrophe modelling, reducing the time and resources required for traditional risk assessment methods.
- - AI enables more precise claims forecasting and management, improving customer satisfaction and cost-efficiency.
- - Insurers leveraging AI can ensure alignment with EU regulations on climate risk reporting and ESG disclosures.
- - AI-driven modelling reduces operational costs by minimizing errors and improving decision-making speed.
- - The market for AI-powered climate catastrophe models is projected to grow significantly, driven by both regulatory requirements and the increasing frequency of extreme weather events.

a. Market Size & Share
The AI-powered climate catastrophe modelling market in the insurance sector is forecasted to experience remarkable growth from 2025 to 2030, driven by a combination of technological advancements and regulatory pressures, notably from the EU's ESG mandate. As insurers increasingly face the pressure of accurately modelling climate-related risks, AI provides a crucial solution for enhancing predictive accuracy. This expansion is particularly crucial given the rising frequency of extreme weather events that impact property, casualty, and reinsurance markets.
By 2030, the market size for AI-based modelling tools is projected to increase from €1.4 billion in 2025 to €5.5 billion, reflecting a compound annual growth rate (CAGR) of 32.1%. The increasing emphasis on sustainability in risk management and the growing necessity for compliance with EU regulations are the primary driving forces behind this growth. Adoption of AI in insurance is expected to enable better alignment with regulatory guidelines while providing more accurate predictions to reduce underwriting and claims costs.
Market Growth Projection (2025-2030):

b. Market Analysis
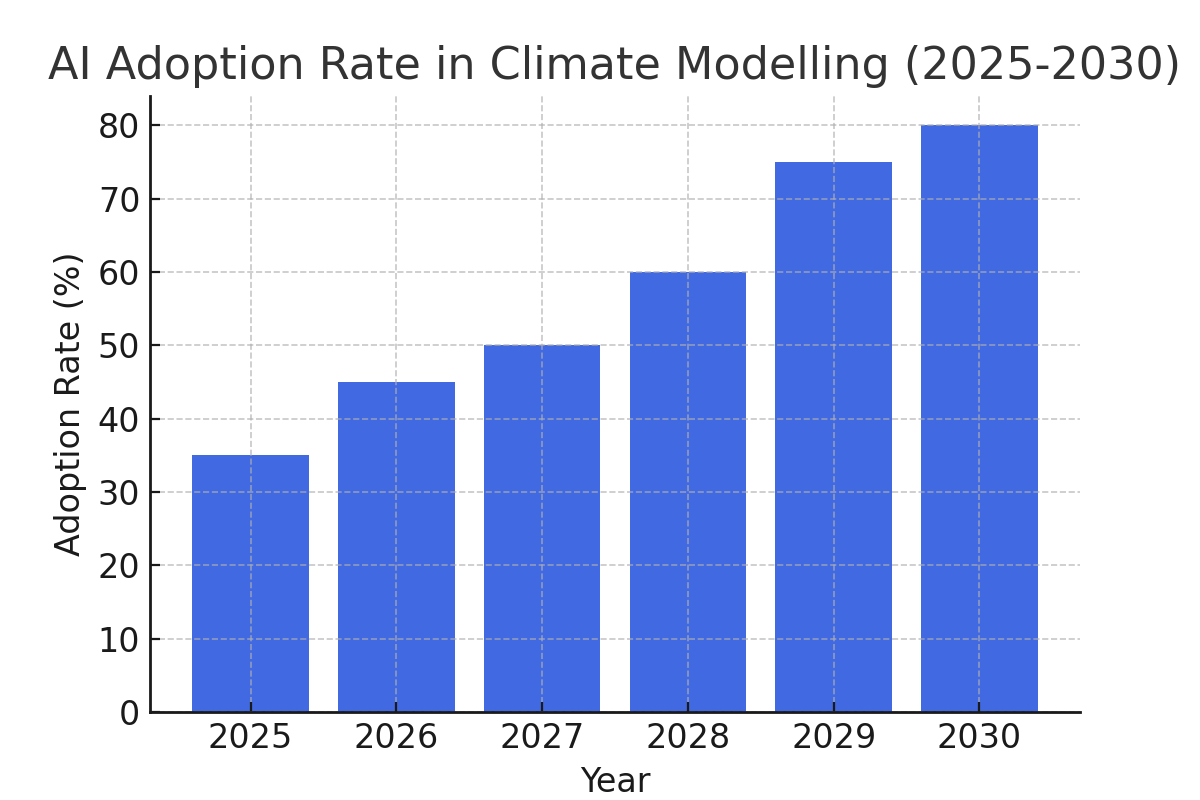
AI adoption in climate catastrophe modelling is rapidly transforming the insurance industry, with both large insurers and emerging tech startups incorporating machine learning to improve their risk assessments. The integration of AI allows for enhanced prediction of catastrophe events, including their frequency and intensity. As climate risks are increasingly seen as a critical business risk, the use of AI helps insurers quantify potential impacts more accurately and efficiently. By 2030, the AI adoption rate in climate modelling is expected to reach 80%, with the major players leading this charge.
The challenges in implementing AI solutions for climate catastrophe modelling include data integration, cost considerations, and the need for specialized talent. However, the long-term benefits of AI adoption—such as more efficient claims handling, reduced operational costs, and better risk mitigation strategies—are compelling insurers to prioritize the integration of AI tools into their processes.
AI Adoption Rate in Climate Modelling (2025-2030):
c. Trends and Insights
The role of AI in climate catastrophe modelling is becoming indispensable as the insurance industry grapples with the increasing unpredictability of climate-related risks. Key trends include the emergence of real-time catastrophe monitoring tools that leverage AI to process and analyze vast datasets faster than ever before. These tools empower insurers to better forecast and manage catastrophic events, helping them to stay ahead of risks and meet ESG requirements. Moreover, AI's predictive capabilities offer valuable insights into potential climate-related risks, driving the evolution of underwriting and claims management strategies.
Another growing trend is the focus on sustainability, where AI-driven solutions are enabling insurers to align their operations with ESG mandates. AI not only helps in predicting risks but also in ensuring that insurance products meet sustainability goals, further enhancing the industry's role in mitigating climate change. By adopting AI models, insurers are increasingly able to offer more tailored, efficient, and forward-looking solutions, driving both regulatory compliance and competitive advantage.
d. Segment Analysis
AI-powered climate catastrophe modelling tools are being deployed across various segments of the insurance market, each with its specific needs and challenges. The property insurance sector is witnessing the largest adoption of AI, as insurers use these tools to predict and manage risks from extreme weather events such as floods, wildfires, and storms. AI models help insurers assess potential property damage, adjust premiums, and prepare for large-scale claims following a catastrophe.
The casualty and reinsurance sectors are also increasingly utilizing AI for assessing long-term climate-related risks. By identifying exposure to emerging climate risks—such as heatwaves, flooding, and drought—AI tools help insurers in these segments refine their offerings, price premiums more accurately, and enhance their overall risk management strategies.
e. Geography Analysis
Europe is leading the adoption of AI-powered climate catastrophe modelling, driven by the EU's regulatory framework. Key markets such as Germany, France, and the UK are at the forefront, with insurers in these regions already integrating AI into their risk assessment and underwriting practices. Southern and Eastern Europe, while slower to adopt, are catching up as the pressure to comply with ESG mandates increases.
The diversity of climate risks across Europe—ranging from floods in the Netherlands to wildfires in Southern Europe—necessitates the use of AI to assess and manage these risks effectively. With the EU's emphasis on sustainability, insurers in Europe are leading the way in adopting AI solutions to meet the regulatory requirements of ESG reporting and disaster risk management.
AI Adoption Across European Regions (2025):

f. Competitive Landscape
The competitive landscape for AI-powered climate catastrophe modelling in insurance is rapidly evolving. Leading global insurers are investing heavily in AI-driven risk models, as they recognize the competitive advantages of more precise catastrophe predictions, enhanced underwriting practices, and compliance with ESG mandates. These large insurers are integrating AI tools into their operations, with the goal of reducing costs and improving operational efficiency.Meanwhile, newer entrants to the market are focusing on making AI solutions more accessible and affordable, targeting smaller insurers and niche markets. These startups are playing a crucial role in democratizing access to AI technology in the insurance industry, which is likely to spur broader adoption in the coming years. The firms that successfully integrate AI into their climate catastrophe modelling will gain significant advantages in terms of risk management, compliance, and operational efficiency.
Report Details
Proceed To Buy
Want a More Customized Experience?
- Request a Customized Transcript: Submit your own questions or specify changes. We’ll conduct a new call with the industry expert, covering both the original and your additional questions. You’ll receive an updated report for a small fee over the standard price.
- Request a Direct Call with the Expert: If you prefer a live conversation, we can facilitate a call between you and the expert. After the call, you’ll get the full recording, a verbatim transcript, and continued platform access to query the content and more.
68 Circular Road, #02-01 049422, Singapore
Revenue Tower, Scbd, Jakarta 12190, Indonesia
4th Floor, Pinnacle Business Park, Andheri East, Mumbai, 400093
Cinnabar Hills, Embassy Golf Links Business Park, Bengaluru, Karnataka 560071
Request Custom Transcript
Related Transcripts

$ 1450


$ 1450


68 Circular Road, #02-01 049422, Singapore
Revenue Tower, Scbd, No.52-53, Jakarta 12190, Indonesia
Cinnabar Hills, Embassy Golf Links Business Park, Bengaluru, Karnataka 560071
4th Floor, Pinnacle Business Park, Andheri East, Mumbai, 400093


68 Circular Road, #02-01 049422, Singapore
Revenue Tower, Scbd, Jakarta 12190, Indonesia
4th Floor, Pinnacle Business Park, Andheri East, Mumbai, 400093
Cinnabar Hills, Embassy Golf Links Business Park, Bengaluru, Karnataka 560071