

68 Circular Road, #02-01 049422, Singapore
Revenue Tower, Scbd, Jakarta 12190, Indonesia
4th Floor, Pinnacle Business Park, Andheri East, Mumbai, 400093
Cinnabar Hills, Embassy Golf Links Business Park, Bengaluru, Karnataka 560071


Connect With Us


68 Circular Road, #02-01 049422, Singapore
Revenue Tower, Scbd, Jakarta 12190, Indonesia
4th Floor, Pinnacle Business Park, Andheri East, Mumbai, 400093
Cinnabar Hills, Embassy Golf Links Business Park, Bengaluru, Karnataka 560071
Connect With Us
68 Circular Road, #02-01 049422, Singapore
Revenue Tower, Scbd, Jakarta 12190, Indonesia
4th Floor, Pinnacle Business Park, Andheri East, Mumbai, 400093
Cinnabar Hills, Embassy Golf Links Business Park, Bengaluru, Karnataka 560071
Request Custom Transcript
Wave Energy Converter and Offshore Renewable Project Optimization: Oscillating Water Column vs Point Absorber Economics
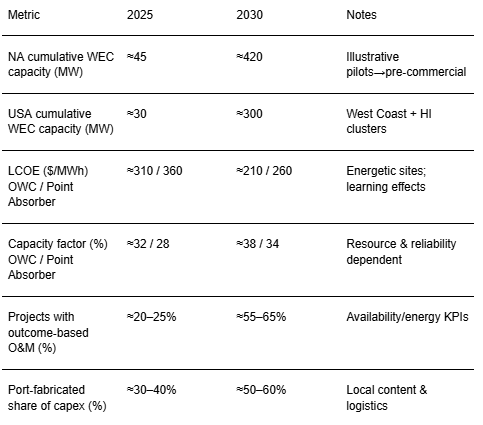
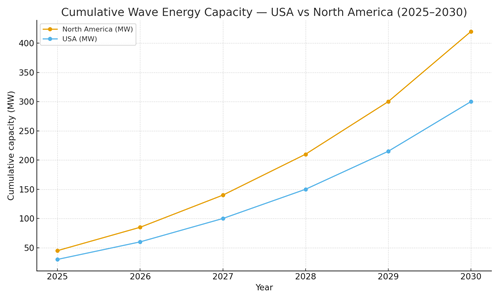
Between 2025 and 2030, wave energy in North America graduates from isolated prototypes to programmatic pilot clusters linked to ports, test sites, and hybrid microgrids. Two archetypes dominate this maturation: the Oscillating Water Column (OWC), typically shore‑adjacent or breakwater‑integrated with mature civil works and air‑turbine modules; and Point Absorbers, compact floating devices tuned to local spectra with modular moorings and power‑take‑off (PTO) units. Developers converge on standardized modules and shared balance‑of‑plant (BOP) export cables, substations, anchors to compress costs and schedules. Quantitatively, this illustrative outlook shows cumulative North America capacity expanding from ~45 MW in 2025 to ~420 MW by 2030, with the USA rising from ~30 MW to ~300 MW as West Coast and Hawaiian clusters scale and Canada’s BC/Atlantic sites add near‑port projects. LCOE trajectories improve on learning rates, reliability gains, and port‑fabrication efficiencies: OWC declines from ~$/MWh 310→210 while Point Absorbers trend ~360→260, with capacity factors climbing from ~28–32% to ~34–38% in energetic regimes. Bankability improves as insurers gain field data on survivability and as outcome‑based service contracts guarantee availability/energy per device.
What's Covered?
Report Summary
Key Takeaways
1) OWC leverages civil integration and simple PTO; Point Absorbers maximize modularity and deployment flexibility.
2) Learning curves and port fabrication drive LCOE down ~30–35% from 2025 to 2030 (illustrative).
3) Availability guarantees and spares pools de‑risk revenue; survivability data unlocks insurance terms.
4) Permitting timelines and port/grid access dominate schedule risk; engage authorities early.
5) Hybridization with microgrids/aquaculture/naval loads diversifies revenue beyond PPAs.
6) Standardized anchors/moorings and wet‑mate connectors reduce install/O&M windows.
7) Digital twins + condition monitoring optimize tuning, reduce truck rolls, and extend PTO life.
8) Programmatic clusters (shared BOP) capture scale benefits vs single‑site pilots.
Key Metrics
Market Size & Share
Wave energy’s near‑term market is defined by pilot clusters adjacent to capable ports and energetic wave climates. In this illustrative outlook, cumulative North American capacity grows from ~45 MW (2025) to ~420 MW (2030), with the USA scaling from ~30 MW to ~300 MW as Oregon/Washington test areas, California’s north/central coast, Hawaii, and select East Coast sites move from single‑device trials to multi‑device arrays. Canada adds capacity in British Columbia and Atlantic provinces near ports and remote coastal loads. Share dynamics hinge on execution: (i) permitting/consenting speed; (ii) ability to share BOP and export cable corridors; (iii) port fabrication and modular assembly that shrink offshore hours; and (iv) reliability/availability performance proven in sea states. OWCs gain share where breakwater or shoreline integration is available, minimizing mooring exposure; point absorbers win where water depth, seabed, and logistics favor floating modules. Developers that standardize device platforms and anchor/mooring kits, and that lock O&M playbooks with local marine contractors, capture disproportionate share as programs scale.
Market Analysis
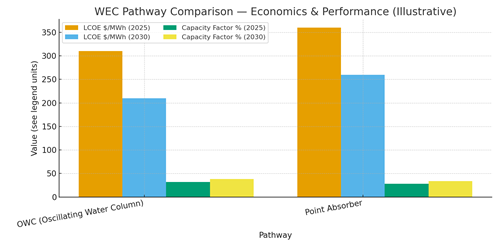
OWC and point absorber pathways trade civil complexity for offshore modularity. OWCs often breakwater‑integrated use chambers and air‑turbine PTO with fewer moving parts in seawater; benefits include ease of inspection and predictable loads, with LCOE trending ~310→210 $/MWh by 2030 in energetic sites. Point absorbers deploy as floating buoys with hydraulic or direct‑drive PTO; they excel in modular fabrication and scalable arrays, with LCOE trending ~360→260 $/MWh. Capacity factors in leading regimes rise toward ~34–38% as tuning/control improves and O&M windows are optimized. Key sensitivities: installation hours (weather), PTO reliability, corrosion/fouling, and export cable/array layout losses. Cost reductions derive from port fabrication, shared BOP, wet‑mate connectors, and condition‑based maintenance. Risk mitigations include redundancy in PTO modules, quick‑disconnect moorings, and helicopter‑safe retrieval. Contracts migrate to outcome‑based service with availability/energy KPIs and liquidated damages/bonus structures. Insurers price survivability using real sea data; developers that document MRV's performance unlock lower premiums and financing costs.
Trends & Insights (2025–2030)
• Programmatic clusters at ports: shared cranes, storage, and assembly lines compress schedules and LCOE.
• Controls‑led performance: real‑time tuning and model‑predictive control lift energy capture and protect PTO.
• Standardized anchors/moorings & wet‑mate connectors reduce offshore hours and enable fast retrieval.
• Digital twins drive PdM and spare strategies; telemetry closes the loop with tuning algorithms.
• Hybridization with offshore wind/solar and microgrids broadens revenue and resilience services.
• Environmental co‑design: monitoring for acoustics, EMF, and habitats streamlines permitting.
• Insurance learns from data: survivability histories lower premiums and widen finance access.
• Workforce development at coastal ports accelerates assembly, towing, and O&M turnaround.
Segment Analysis
• Utility‑scale pilots (5–20 MW arrays): prioritize shared BOP, export corridors, and grid‑ready substations; near ports with heavy‑lift capacity.
• Remote/island microgrids: Hawaii/Alaska and coastal First Nations communities; value resilience and diesel displacement.
• Blue‑economy loads: aquaculture and desalination platforms; steady baseload and proximity to resource.
• Defense/test sites: controlled access, data‑rich environments, and accelerated permitting windows.
Buyer guidance: choose pathway by site constraints; design O&M around weather windows; standardize modules and anchors; and contract outcome KPIs (availability, energy/device, repair time).
Geography Analysis (USA & North America)
Readiness clusters along the U.S. West Coast (Oregon/Washington, Northern/Central California) with strong wave resource and port infrastructure, extends to Hawaii and Alaska for microgrids, and includes Canada’s BC and Atlantic provinces for port‑adjacent pilots. The Northeast advances selectively where permitting and grid interconnection align. The stacked criteria wave resource, grid/port infrastructure, permitting cadence, supply chain depth, and offtake/policy support show where balanced ecosystems enable rapid scaling.
Implications: stage multi‑site portfolios anchored at ports; share BOP across arrays; pre‑negotiate permits and environmental monitoring; and harmonize KPIs to enable vendor competition and finance.

Competitive Landscape (Ecosystem & Delivery Models)
Competition spans device OEMs (OWC modules, point absorbers), mooring/anchor specialists, marine contractors, port fabricators, EPC integrators, grid/offtake partners, and insurers. Differentiators: proven survivability, availability, energy per device, install/O&M hours, and transparent MRV. Leaders deliver standardized device platforms, shared BOP, and outcome‑based O&M with availability and energy guarantees. Delivery models evolve from single‑site pilots to port‑anchored portfolios, pooling spares and crews to reduce cost and risk. Winning strategies pair robust engineering with permitting fluency, local supply chain partnerships, and data‑driven O&M. Vendors that minimize offshore hours, document performance, and align contracts to measurable outcomes will capture North America’s early wave energy market through 2030.
Report Details
Proceed To Buy
Want a More Customized Experience?
- Request a Customized Transcript: Submit your own questions or specify changes. We’ll conduct a new call with the industry expert, covering both the original and your additional questions. You’ll receive an updated report for a small fee over the standard price.
- Request a Direct Call with the Expert: If you prefer a live conversation, we can facilitate a call between you and the expert. After the call, you’ll get the full recording, a verbatim transcript, and continued platform access to query the content and more.
68 Circular Road, #02-01 049422, Singapore
Revenue Tower, Scbd, Jakarta 12190, Indonesia
4th Floor, Pinnacle Business Park, Andheri East, Mumbai, 400093
Cinnabar Hills, Embassy Golf Links Business Park, Bengaluru, Karnataka 560071
Request Custom Transcript
Related Transcripts
$ 1445


$ 1345
$ 1432

68 Circular Road, #02-01 049422, Singapore
Revenue Tower, Scbd, No.52-53, Jakarta 12190, Indonesia
Cinnabar Hills, Embassy Golf Links Business Park, Bengaluru, Karnataka 560071
4th Floor, Pinnacle Business Park, Andheri East, Mumbai, 400093


68 Circular Road, #02-01 049422, Singapore
Revenue Tower, Scbd, Jakarta 12190, Indonesia
4th Floor, Pinnacle Business Park, Andheri East, Mumbai, 400093
Cinnabar Hills, Embassy Golf Links Business Park, Bengaluru, Karnataka 560071