

68 Circular Road, #02-01 049422, Singapore
Revenue Tower, Scbd, Jakarta 12190, Indonesia
4th Floor, Pinnacle Business Park, Andheri East, Mumbai, 400093
Cinnabar Hills, Embassy Golf Links Business Park, Bengaluru, Karnataka 560071


Connect With Us


68 Circular Road, #02-01 049422, Singapore
Revenue Tower, Scbd, Jakarta 12190, Indonesia
4th Floor, Pinnacle Business Park, Andheri East, Mumbai, 400093
Cinnabar Hills, Embassy Golf Links Business Park, Bengaluru, Karnataka 560071
Connect With Us
68 Circular Road, #02-01 049422, Singapore
Revenue Tower, Scbd, Jakarta 12190, Indonesia
4th Floor, Pinnacle Business Park, Andheri East, Mumbai, 400093
Cinnabar Hills, Embassy Golf Links Business Park, Bengaluru, Karnataka 560071
Request Custom Transcript
Tidal Energy Development and Deployment: Turbine Durability & Marine Ecosystem Impact Mitigation
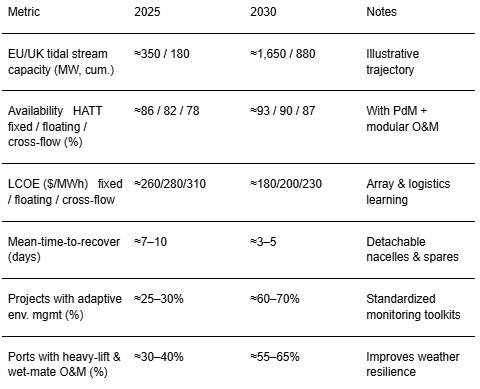
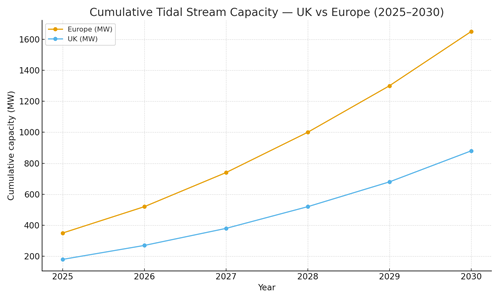
Between 2025 and 2030, tidal stream power in the UK and Europe shifts from grant‑backed pilots to clustered pre‑commercial arrays anchored at ports with fabrication and O&M capacity. Durability and environmental credibility become the make‑or‑break factors for bankability. Turbine OEMs converge on two dominant lanes: horizontal‑axis tidal turbines (HATT) in fixed‑bottom or floating configurations, and cross‑flow/vertical‑axis designs. Across lanes, design-for-maintenance (wet‑mate connectors, detachable nacelles, standardized blades) compresses offshore hours and raises availability. Quantitatively, this illustrative trajectory shows cumulative European tidal capacity growing from ~350 MW in 2025 to ~1,650 MW by 2030, with the UK rising from ~180 to ~880 MW as Scottish straits and Welsh channels scale first. Availability improves from the high‑70s/low‑80s to ~90%+ through modular drivetrains, corrosion/fouling control, and data‑led predictive maintenance. LCOE trends down from ~$260–310/MWh (2025) toward ~$180–230/MWh (2030) as arrays grow, installation windows widen with better marine logistics, and learning rates accrue.

What's Covered?
Report Summary
Key Takeaways
1) Durability is the economic lever: modular drivetrains + wet‑mate connectors cut offshore hours.
2) Availability can reach ~90%+ by 2030; arrays win with spares pools and fast‑swap nacelles.
3) LCOE declines with array scale, port fabrication, and better weather windows/logistics.
4) Standardized, auditable marine monitoring earns regulator trust and lowers soft costs.
5) Collision risk management blends active acoustics, ML vision, and seasonal operations.
6) Adaptive management frameworks replace one‑off studies and speed consent renewals.
7) Outcome‑based SLAs: availability, energy/device, MTTR, and environmental KPIs.
8) Clustered portfolios near capable ports capture supply‑chain and O&M synergies.
Key Metrics
Market Size & Share
Tidal build‑out concentrates in high‑resource passages with mature port access and community support. In this illustrative outlook, cumulative European capacity grows from ~350 MW (2025) to ~1,650 MW (2030); the UK rises from ~180 to ~880 MW as Scottish straits and Welsh channels expand clustered arrays tied to capable ports. Share accrues to OEM‑developer pairs that deliver availability >90%, bankable environmental monitoring, and fast‑turn O&M. Floating HATTs gain traction where depths increase and installation windows are tight; fixed‑bottom HATTs lead in shallower, high‑flow sites with solid foundations; cross‑flow devices carve niches in turbulence‑tolerant deployments.
Port‑centric fabrication and standardized BOP (anchors, cables, connectors) compress capex and installation risk. Grid interconnection at coastal substations, batteries for ramp‑smoothing, and ancillary services contracts increase revenue certainty. By 2030, arrays co‑optimize energy yield and maintenance access, under outcome‑based SLAs tied to availability, MTTR, and environmental KPIs.
Market Analysis
Durability and logistics dominate economics. In this outlook, availability improves from ~78–86% in 2025 to ~87–93% by 2030 as modular drivetrains, improved seals/bearings, anti‑fouling coatings, and condition monitoring reduce unplanned retrievals. LCOE trends from ~$260–310/MWh to ~$180–230/MWh as arrays scale, installation windows expand with better marine ops, and spare parts logistics are pooled across clusters. Fixed‑bottom HATTs offer structural simplicity but require heavier lifts; floating HATTs reduce installation depth constraints and enable quayside maintenance; cross‑flow designs tolerate turbulence and convey lower peak loads on moorings but may trail on peak efficiency. Key risk drivers: seal/bearing wear, cable/connectors fatigue, storm survivability, and consenting delays tied to environmental uncertainty. Mitigations: detachable nacelles and wet‑mate connectors; redundancy in critical PTO modules; structural health monitoring; and standardized, regulator‑endorsed monitoring plans. Economics improve with clustered arrays that share vessels, crews, and spares, and with contracts that align OEM and operator incentives via availability and MTTR bonuses/LDs.

Trends & Insights (2025–2030)
• Modular O&M: detachable nacelles, wet‑mate connectors, and standardized blades minimize offshore exposure.
• Predictive maintenance: vibration/temperature analytics and digital twins extend bearing/seal life.
• Materials & coatings: corrosion‑resistant alloys and anti‑fouling coatings cut drag and service needs.
• Environmental toolkits: active acoustics + ML vision for collision risk; seasonal/noise‑managed installs.
• Grid coupling: batteries and ancillary services monetize predictability; quayside maintenance reduces downtime.
• Port ecosystems: heavy‑lift cranes, laydown areas, and local fabrication accelerate arrays and create jobs.
• Insurance learning: survivability data tightens premiums and unlocks longer‑tenor finance.
• Policy evolution: streamlined consenting and standardized monitoring across the UK & EU reduce soft costs.
Segment Analysis
• Fixed‑bottom HATT sites: shallow, high‑flow channels with firm seabeds; emphasize foundation design, cabling, and quick‑swap nacelles.
• Floating HATT sites: deeper/high‑flow straits; focus on mooring dynamics, tow‑to‑port maintenance, and array control.
• Cross‑flow arrays: turbulence‑tolerant deployments; modular strings near ports and remote communities.
• Hybrid microgrids & remote islands: tidal + storage for baseload; resilience value complements PPAs.
Buyer guidance: align lane to depth/seabed and logistics; specify availability/MTTR KPIs; pre‑agree environmental monitoring and adaptive management; and structure O&M to pool vessels/spares across clusters.
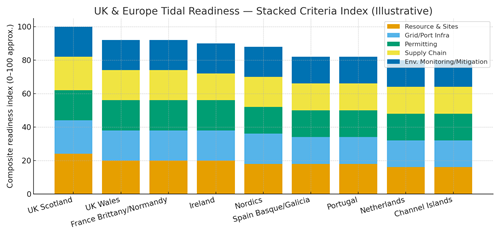
Geography Analysis (UK & Europe)
Readiness peaks in Scotland’s straits and Welsh channels, followed by France’s Brittany/Normandy coasts and Irish sites; Nordics and Iberia add select projects; the Netherlands focuses on demonstrators and supply‑chain roles. The stacked criteria resource & sites, grid/port infrastructure, permitting cadence, supply chain depth, and environmental monitoring/mitigation highlight where balanced ecosystems enable rapid scaling and credible environmental performance.
Implications: anchor portfolios at capable ports; standardize monitoring toolkits; pool spares and vessels; and harmonize KPIs (availability, MTTR, environmental indicators) to support competition and finance.
Competitive Landscape (Ecosystem & Delivery Models)
Competition spans turbine OEMs (HATT fixed/floating, cross‑flow), foundation/mooring specialists, marine contractors, port fabricators, environmental monitoring firms, storage partners, and financiers. Differentiators: availability and MTTR performance, proven survivability, LCOE trajectory, and auditable environmental monitoring. Leaders deliver integrated packages device + foundation/mooring + monitoring toolkit + O&M playbook under outcome‑based contracts tied to availability, energy/device, MTTR, and environmental KPIs. Delivery models evolve from single pilots to clustered arrays with shared BOP and port infrastructure. Players that minimize offshore hours, document environmental performance, and align incentives through outcome‑based SLAs will capture UK & Europe tidal growth through 2030.
Report Details
Proceed To Buy
Want a More Customized Experience?
- Request a Customized Transcript: Submit your own questions or specify changes. We’ll conduct a new call with the industry expert, covering both the original and your additional questions. You’ll receive an updated report for a small fee over the standard price.
- Request a Direct Call with the Expert: If you prefer a live conversation, we can facilitate a call between you and the expert. After the call, you’ll get the full recording, a verbatim transcript, and continued platform access to query the content and more.
68 Circular Road, #02-01 049422, Singapore
Revenue Tower, Scbd, Jakarta 12190, Indonesia
4th Floor, Pinnacle Business Park, Andheri East, Mumbai, 400093
Cinnabar Hills, Embassy Golf Links Business Park, Bengaluru, Karnataka 560071
Request Custom Transcript
Related Transcripts

68 Circular Road, #02-01 049422, Singapore
Revenue Tower, Scbd, No.52-53, Jakarta 12190, Indonesia
Cinnabar Hills, Embassy Golf Links Business Park, Bengaluru, Karnataka 560071
4th Floor, Pinnacle Business Park, Andheri East, Mumbai, 400093


68 Circular Road, #02-01 049422, Singapore
Revenue Tower, Scbd, Jakarta 12190, Indonesia
4th Floor, Pinnacle Business Park, Andheri East, Mumbai, 400093
Cinnabar Hills, Embassy Golf Links Business Park, Bengaluru, Karnataka 560071