

68 Circular Road, #02-01 049422, Singapore
Revenue Tower, Scbd, Jakarta 12190, Indonesia
4th Floor, Pinnacle Business Park, Andheri East, Mumbai, 400093
Cinnabar Hills, Embassy Golf Links Business Park, Bengaluru, Karnataka 560071


Connect With Us


68 Circular Road, #02-01 049422, Singapore
Revenue Tower, Scbd, Jakarta 12190, Indonesia
4th Floor, Pinnacle Business Park, Andheri East, Mumbai, 400093
Cinnabar Hills, Embassy Golf Links Business Park, Bengaluru, Karnataka 560071
Connect With Us
68 Circular Road, #02-01 049422, Singapore
Revenue Tower, Scbd, Jakarta 12190, Indonesia
4th Floor, Pinnacle Business Park, Andheri East, Mumbai, 400093
Cinnabar Hills, Embassy Golf Links Business Park, Bengaluru, Karnataka 560071
Request Custom Transcript
Sustainable Aviation Fuel (SAF) Market Landscape: Feedstock Sourcing & Refinery Retrofits
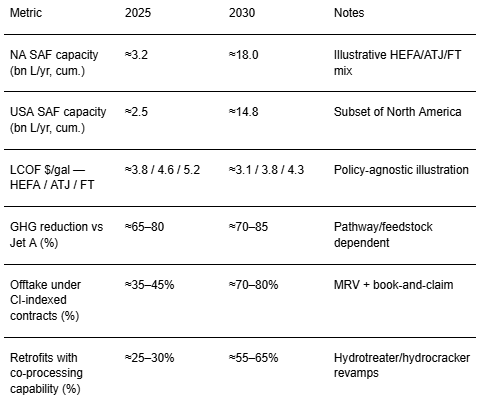
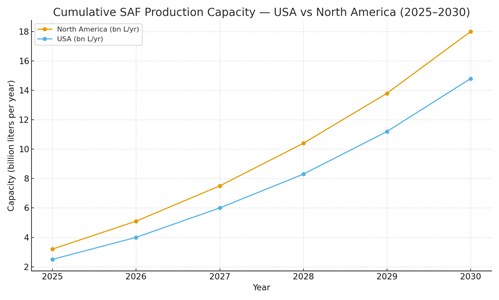
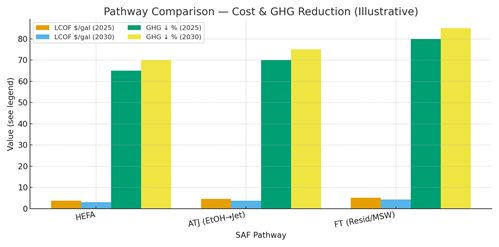
From 2025 to 2030, North America’s SAF industry transitions from demonstration batches to programmatic scale‑up anchored in low‑CI feedstock aggregation, refinery co‑processing retrofits, and dedicated units for HEFA, Alcohol‑to‑Jet (ATJ), and Fischer‑Tropsch (FT). Airlines secure multi‑year offtakes indexed to verified carbon intensity (CI), while producers compete on feedstock security, conversion yields, and hub logistics. The USA leads on policy stacking and retrofit candidates; Canada expands with lipid and forestry residues; Mexico progresses where airport demand, waste streams, and policy alignment intersect. Illustratively, cumulative SAF capacity in North America could grow from ~3.2 to ~18.0 bn L/yr by 2030, with the USA rising from ~2.5 to ~14.8 bn L/yr. HEFA remains the near‑term workhorse, benefiting from existing hydroprocessing trains and lower execution risk; ATJ scales on ethanol corridors and emerging e‑alcohol routes; FT adds deep decarbonization potential using MSW and woody residues, albeit with higher capex and integration complexity. Levelized costs trend down—HEFA toward ~$3.1/gal, ATJ ~$3.8/gal, FT ~$4.3/gal by 2030 in this outlook—as plants enlarge, heat integration improves, and CI‑linked credits sharpen incentives. Lifecycle GHG reductions span ~70–85% depending on pathway, feedstock, and utilities.

What's Covered?
Report Summary
Key Takeaways
1) HEFA delivers near‑term volumes; ATJ and FT expand scale and deepen decarbonization.
2) Feedstock security with CI verification is the primary competitive moat.
3) Retrofit scope = hydrotreaters + isomerization + fractionation + segregated logistics.
4) CI‑indexed offtake and digital MRV enable financeable portfolios.
5) Hydrogen/power CI materially shifts both LCOF and lifecycle emissions.
6) Catalyst/pre‑treatment programs protect yields and uptime under variable feeds.
7) Regional hubs: U.S. Gulf, West, and Midwest; Canada adds lipids/forestry residues.
8) Outcome‑based EPC/O&M KPIs: yield, CI/MJ, uptime, product spec compliance.
Key Metrics
Market Size & Share
North America’s SAF build‑out is shaped by feedstock corridors, brownfield retrofit potential, and airport demand density. In this illustrative view, cumulative capacity grows from ~3.2 bn L/yr (2025) to ~18.0 bn L/yr (2030), with the USA scaling from ~2.5 to ~14.8 bn L/yr. Early share accrues to HEFA retrofit clusters adjacent to lipid supply and hydroprocessing units, where revamps compress schedule and capex. ATJ adds diversification as ethanol‑to‑jet units tie into existing rail/terminal infrastructure; FT emerges where MSW/woody residues and oxygen supply support gasification/FT trains. Airlines with science‑based targets anchor offtake at major hubs, often paying CI premia for verified reductions. Share is won by developers that secure bankable feed contracts, execute robust pre‑treatment, and deliver on‑spec jet with high on‑stream factors. MRV‑ready CI accounting and digital batch passports underpin CI‑indexed pricing and book‑and‑claim markets, broadening addressable demand beyond physical pipeline reach. By 2030, multi‑pathway portfolios dominate, balancing HEFA volume with ATJ’s ethanol integration and FT’s deep decarbonization.
Market Analysis
Pathway economics reflect trade‑offs among capex, yields, utilities, and CI. HEFA benefits from existing hydrotreaters/hydrocrackers, giving lower execution risk and costs trending to ~$3.1/gal by 2030 in this outlook; sensitivities include lipid feed prices, pre‑treatment severity, and hydrogen costs. ATJ economics depend on ethanol pricing, dehydration/oligomerization yields, and low‑CI power. FT offers ~80–85% GHG reduction potential but carries higher capex and integration complexity (gasification, tar control, oxygen supply). Across paths, CI‑aligned credits and utilities sourcing dominate upside/downside. Operational risks center on catalysts (poisons, coking), feed variability, and spec guardrails (freeze point, aromatics, sulfur). Mitigations include diversified feed baskets, advanced pre‑treatment, rigorous online analytics, and outcome‑based EPC/O&M with KPIs for yield, CI/MJ, uptime, and product quality.
Trends & Insights (2025–2030)
• Feedstock platforms: lipid hubs with traceability; ethanol corridors; MSW/woody residue consortia.
• Modular retrofits: isomerization/fractionation skids reduce outages and ramp risks.
• Low‑CI utilities: SMR+CCS or electrolytic H₂ and renewable power shift CI and LCOF.
• MRV by design: digital CI accounting and batch passports for CI‑indexed pricing.
• Book‑and‑claim market growth decouples physical supply from CI attribution.
• Catalyst/pretreat advances extend run lengths and tolerance to contaminants.
• Airport co‑investment in blending/tankage/QC accelerates adoption.
• Finance shifts to outcome guarantees on yield, CI, uptime, spec compliance.
Segment Analysis
• HEFA retrofits/co‑processing: ideal for sites with hydrotreaters/hydrocrackers, lipid supply, and H₂ networks; near‑term volume leader.
• ATJ: aligns with ethanol producers and terminal/rail infrastructure; key levers are yields and low‑CI power.
• FT: suited to waste‑rich metros/forestry regions; higher capex with deeper GHG cuts and broader feed baskets.
• Airport/airline hubs: demand centers with CI‑indexed procurement and blending facilities.
Buyer guidance: match pathway to site assets and feed corridors; secure CI‑verified feed; plan H₂/power decarbonization; design MRV and CI‑indexed offtake; embed outcome KPIs in EPC/O&M.
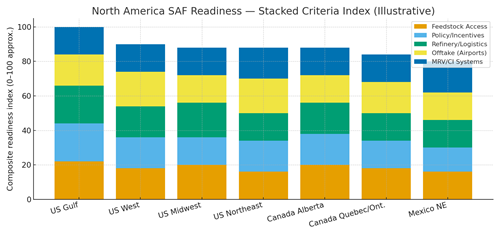
Geography Analysis (USA & North America)
Readiness concentrates in the U.S. Gulf (refineries, pipelines, airports), U.S. West (waste‑to‑fuel, low‑CI power), and the Midwest (ethanol and soy corridors). Alberta and Quebec/Ontario add lips/forestry feeds and airport demand; the U.S. Northeast advances where blending/tankage and MRV are in place; northern Mexico progresses where airport demand and waste streams align with policy. The stacked criteria—feedstock access, policy/incentives, refinery/logistics suitability, airport offtake, and MRV/CI systems highlight where balanced ecosystems support rapid scaling and bankable projects.
Implications: stage multi‑site programs in high‑readiness hubs; co‑develop airport blending and tankage; implement digital MRV; and standardize CI‑indexed offtake clauses to enable competition.
Competitive Landscape (Ecosystem & Delivery Models)
Competitors span feed aggregators, retrofit/EPC integrators, technology licensors (HEFA/ATJ/FT), hydrogen/power providers, airport handlers, and MRV/CI platforms. Differentiators: secured feed with verified CI, proven yields and uptime, low‑CI utilities, and traceable logistics. Leaders deliver integrated packages feed contracts → retrofit execution → MRV/CI accounting → CI‑indexed offtake under outcome‑based guarantees (yield, CI/MJ, uptime, spec compliance). Airport partnerships for blending/tankage and co‑investment de‑risk offtake.
Delivery models move toward portfolio finance anchored by airline/airport contracts and CI credits. Players combining reliable conversion, credible CI tracking, and flexible logistics will capture North America’s SAF growth through 2030.
Report Details
Proceed To Buy
Want a More Customized Experience?
- Request a Customized Transcript: Submit your own questions or specify changes. We’ll conduct a new call with the industry expert, covering both the original and your additional questions. You’ll receive an updated report for a small fee over the standard price.
- Request a Direct Call with the Expert: If you prefer a live conversation, we can facilitate a call between you and the expert. After the call, you’ll get the full recording, a verbatim transcript, and continued platform access to query the content and more.
68 Circular Road, #02-01 049422, Singapore
Revenue Tower, Scbd, Jakarta 12190, Indonesia
4th Floor, Pinnacle Business Park, Andheri East, Mumbai, 400093
Cinnabar Hills, Embassy Golf Links Business Park, Bengaluru, Karnataka 560071
Request Custom Transcript
Related Transcripts

$ 1445

$ 1345
$ 1432

68 Circular Road, #02-01 049422, Singapore
Revenue Tower, Scbd, No.52-53, Jakarta 12190, Indonesia
Cinnabar Hills, Embassy Golf Links Business Park, Bengaluru, Karnataka 560071
4th Floor, Pinnacle Business Park, Andheri East, Mumbai, 400093


68 Circular Road, #02-01 049422, Singapore
Revenue Tower, Scbd, Jakarta 12190, Indonesia
4th Floor, Pinnacle Business Park, Andheri East, Mumbai, 400093
Cinnabar Hills, Embassy Golf Links Business Park, Bengaluru, Karnataka 560071