

68 Circular Road, #02-01 049422, Singapore
Revenue Tower, Scbd, Jakarta 12190, Indonesia
4th Floor, Pinnacle Business Park, Andheri East, Mumbai, 400093
Cinnabar Hills, Embassy Golf Links Business Park, Bengaluru, Karnataka 560071


Connect With Us


68 Circular Road, #02-01 049422, Singapore
Revenue Tower, Scbd, Jakarta 12190, Indonesia
4th Floor, Pinnacle Business Park, Andheri East, Mumbai, 400093
Cinnabar Hills, Embassy Golf Links Business Park, Bengaluru, Karnataka 560071
Connect With Us
68 Circular Road, #02-01 049422, Singapore
Revenue Tower, Scbd, Jakarta 12190, Indonesia
4th Floor, Pinnacle Business Park, Andheri East, Mumbai, 400093
Cinnabar Hills, Embassy Golf Links Business Park, Bengaluru, Karnataka 560071
Request Custom Transcript
Second-Life EV Battery and Circular Battery Management: Grid-Scale Storage Applications & Degradation Monitoring
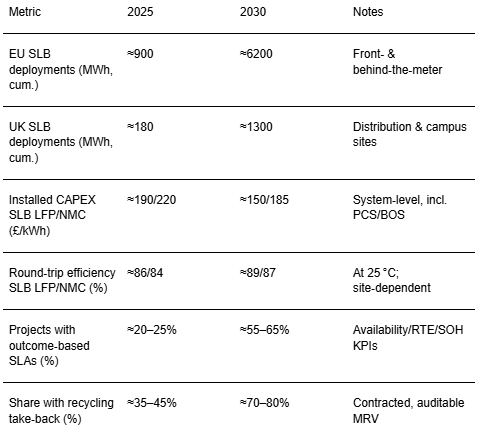
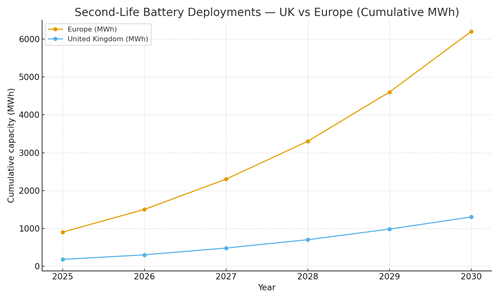
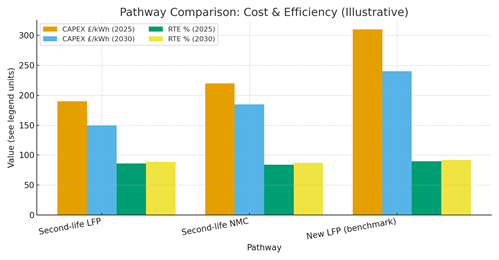
From 2025 to 2030, second‑life EV batteries (SLB) evolve from pilots to portfolio assets in Europe’s grid‑scale storage stack. Industrial parks, distribution substations, and behind‑the‑meter campuses adopt SLB for peak‑shaving, capacity firming, and contingency services, while front‑of‑the‑meter projects target ancillary markets (FCR/FRR) and local flexibility schemes. The value thesis couples low installed cost with robust degradation monitoring and safety by design. UK and Benelux clusters lead on take‑back programs, pack traceability, and standardized testing; Germany scales remanufacturing capacity and digital twins; the Nordics bring clean power and strong recycling back‑stops. Quantitatively, this illustrative outlook shows cumulative European deployments growing from ~0.9 GWh in 2025 to ~6.2 GWh by 2030, with the UK rising from ~0.18 GWh to ~1.3 GWh. Installed CAPEX trends toward ~£150–185/kWh for SLB by 2030 versus ~£240/kWh for new LFP, while round‑trip efficiency (RTE) improves from ~84–86% to ~87–89% as grading, BMS retrofit, and thermal controls mature. Revenue stacking mixes frequency response, peak‑shaving, distribution deferral, and capacity contracts; warranties shift from simple throughput to outcome‑based service metrics (availability, RTE, response time, and SOH trajectories).
What's Covered?
Report Summary
Key Takeaways
1) Second‑life systems undercut new‑build LFP on CAPEX by ~20–30% by 2030 (illustrative).
2) Bankability = standardized testing, serialized traceability, and conservative thermal/fire design.
3) Outcome‑based SLAs (availability, RTE, response, SOH) replace throughput‑only warranties.
4) Degradation models (physics‑informed + fleet learning) optimize dispatch and extend life.
5) UK/Benelux lead on take‑back and flexibility markets; Germany scales remanufacturing.
6) Revenue stacking: FCR/FRR + peak‑shaving + capacity + local flexibility services.
7) End‑of‑second‑life routed to verified recyclers with MRV and metal‑recovery KPIs.
8) Digital twins and anomaly detection reduce downtime and warranty disputes.
Key Metrics
Market Size & Share
Second‑life batteries move from opportunistic pilots to standardized products across Europe by 2030. In this illustrative outlook, cumulative deployments grow from ~0.9 GWh (2025) to ~6.2 GWh (2030), with the UK rising from ~0.18 to ~1.3 GWh. Share concentrates where pack supply, standards, and market access intersect UK and Benelux leverage take‑back programs and flexibility markets; Germany scales remanufacturing; the Nordics pair clean power with robust recycling. Integrators that control feedstock, testing, and BOS deliver at lower cost with faster schedules.
As portfolios mature, SLB competes in 1–3‑hour applications (FCR/FRR, peak‑shaving, ramping). New LFP remains the benchmark for deeper cycling; however, SLB’s lower CAPEX and improving RTE close gaps for many grid‑support services. Developers win share by standardizing racking, BMS retrofit kits, and commissioning procedures that handle mixed modules safely and predictably.
Market Analysis
SLB economics hinge on installed CAPEX, RTE, and predictable degradation. By 2030, illustrative installed costs trend toward ~£150–185/kWh for SLB versus ~£240/kWh for new LFP, while RTE improves to ~87–89% as grading, BMS, and thermal systems mature. For many frequency and peak applications, this yields competitive LCOS despite shorter warranted cycles. Key sensitivities: module heterogeneity, thermal gradients, calendar fade at partial SOC, and response‑time penalties. Mitigations include tighter grading windows, module matching, de‑rating by temperature, and dispatch limits informed by SOH models.
Emphasis shifts to outcome‑based SLAs availability, response time, RTE and SOH trajectory with LDs/bonuses. Insurance and finance respond to serialized traceability and auditable data; digital twins and anomaly detection reduce downtime, enabling proactive maintenance and warranty defense.
Trends & Insights (2025–2030)
• Serial take‑back and grading centers near OEM/logistics hubs stabilize supply and quality.
• Testing standardization (OCV‑SOC, DCIR, EIS) and digital passports underpin warranties and finance.
• BMS retrofit and pack‑level telemetry enable cell balancing across mixed modules and aging drifts.
• Physics‑informed + ML degradation models guide dispatch and warranty KPIs; SOH becomes a contracted metric.
• Safety‑by‑design: racking with thermal barriers, off‑gas detection, selective suppression, and conformity to UL/IEC.
• Revenue stacking via flexibility markets and DSO programs; guardrails protect life (DoD/temperature windows).
• Circularity: contracted take‑back to hydro met recyclers with MRV on metal recovery.
• Portfolio management: standardized racking/PCS and spares pools compress commissioning and O&M cost.
Segment Analysis
• Front‑of‑the‑meter (FCR/FRR, local flexibility): 1–2 h SLB with high response and conservative cycling; strong in UK/Benelux markets.
• Distribution deferral & peak‑shaving: 2–3 h SLB at substations/campuses; value from avoided capex and reliability improvements.
• Behind‑the‑meter industrial/campus: demand‑charge management, backup, and PV smoothing; tight thermal/safety design is essential.
• Microgrids: resilience‑first deployments in ports and logistics parks; mixed SLB + new LFP portfolios for depth.
Buyer guidance: define duty cycles and KPIs; require standardized testing and serial traceability; specify safety/thermal design; select markets with stable revenues; and lock recycling pathways.
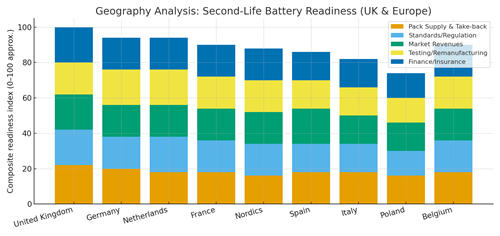
Geography Analysis (UK & Europe)
The UK leads on revenue access (FCR/FFR/local flexibility) and take‑back programs; Germany scales testing/remanufacturing capacity; the Netherlands benefits from ports/logistics and refinery clusters; the Nordics pair clean power with strong recycling; Spain and Italy expand with DSO flexibility pilots; Poland and Belgium grow as standards and finance mature. The stacked criteria pack supply & take‑back, standards/regulation, market revenues, testing/remanufacturing, finance/insurance show where balanced ecosystems support scale.
Implications: site grading hubs near logistics/OEM nodes; build standardized racking/BMS kits; contract outcome‑based SLAs; and integrate circular take‑back with MRV to unlock finance and insurance.
Competitive Landscape (Ecosystem & Delivery Models)
Competitors span OEM‑linked take‑back programs, independent graders/remanufacturers, BMS/PCS integrators, EPCs, and recyclers. Differentiators: standardized testing and data integrity, safety engineering, dispatch optimization tied to SOH, and outcome‑based SLAs. Leaders integrate supply, testing, BOS, and recycling through a single data spine, offering bankable warranties and portfolio management. Delivery models shift toward energy‑as‑a‑service and availability‑indexed contracts; finance values serial traceability, MRV for circular outcomes, and performance dashboards. Portfolios that blend SLB for power and new LFP for energy depth can optimize LCOS and risk across use cases through 2030.
Report Details
Proceed To Buy
Want a More Customized Experience?
- Request a Customized Transcript: Submit your own questions or specify changes. We’ll conduct a new call with the industry expert, covering both the original and your additional questions. You’ll receive an updated report for a small fee over the standard price.
- Request a Direct Call with the Expert: If you prefer a live conversation, we can facilitate a call between you and the expert. After the call, you’ll get the full recording, a verbatim transcript, and continued platform access to query the content and more.
68 Circular Road, #02-01 049422, Singapore
Revenue Tower, Scbd, Jakarta 12190, Indonesia
4th Floor, Pinnacle Business Park, Andheri East, Mumbai, 400093
Cinnabar Hills, Embassy Golf Links Business Park, Bengaluru, Karnataka 560071
Request Custom Transcript
Related Transcripts


68 Circular Road, #02-01 049422, Singapore
Revenue Tower, Scbd, No.52-53, Jakarta 12190, Indonesia
Cinnabar Hills, Embassy Golf Links Business Park, Bengaluru, Karnataka 560071
4th Floor, Pinnacle Business Park, Andheri East, Mumbai, 400093


68 Circular Road, #02-01 049422, Singapore
Revenue Tower, Scbd, Jakarta 12190, Indonesia
4th Floor, Pinnacle Business Park, Andheri East, Mumbai, 400093
Cinnabar Hills, Embassy Golf Links Business Park, Bengaluru, Karnataka 560071