

68 Circular Road, #02-01 049422, Singapore
Revenue Tower, Scbd, Jakarta 12190, Indonesia
4th Floor, Pinnacle Business Park, Andheri East, Mumbai, 400093
Cinnabar Hills, Embassy Golf Links Business Park, Bengaluru, Karnataka 560071


Connect With Us


68 Circular Road, #02-01 049422, Singapore
Revenue Tower, Scbd, Jakarta 12190, Indonesia
4th Floor, Pinnacle Business Park, Andheri East, Mumbai, 400093
Cinnabar Hills, Embassy Golf Links Business Park, Bengaluru, Karnataka 560071
Connect With Us
68 Circular Road, #02-01 049422, Singapore
Revenue Tower, Scbd, Jakarta 12190, Indonesia
4th Floor, Pinnacle Business Park, Andheri East, Mumbai, 400093
Cinnabar Hills, Embassy Golf Links Business Park, Bengaluru, Karnataka 560071
Request Custom Transcript
Post-Combustion Carbon Capture, Utilization, and Storage (CCUS) Systems: Solvent-Based Systems & Power Plant Retrofits
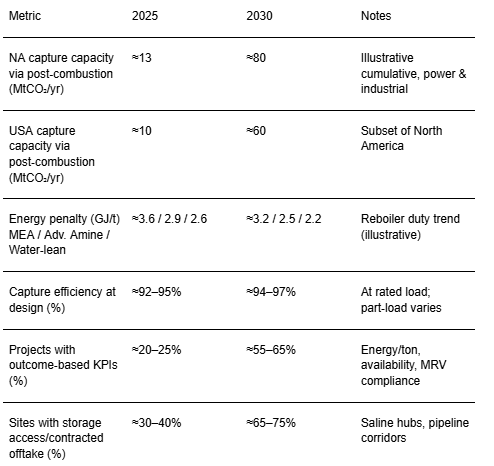
Between 2025 and 2030, North American post‑combustion CCUS moves from demonstration to scaled deployment on coal and natural‑gas power plants, cement, and industrial boilers. The economic engine is solvent‑based capture paired with reliable transport and Class VI storage or EOR‑to‑storage transitions. Technology leadership consolidates around advanced amines (e.g., piperazine/AMP blends) and water‑lean/non‑aqueous solvents that cut reboiler duty while sustaining high capture rates and manageable degradation. Retrofit designs standardize: compact absorbers, high‑performance structured packing, lean‑rich heat integration, advanced reclaiming, and corrosion‑resistant metallurgy. Digital twins and plant‑wide optimization reduce parasitic load and ramping penalties. Illustratively, cumulative capture capacity addressed by post‑combustion retrofits in North America could grow from ~13 to ~80 MtCO₂/yr by 2030, with the USA rising from ~10 to ~60 MtCO₂/yr. Energy penalty trends decline from ~3.6 GJ/t (MEA) toward ~2.2–2.5 GJ/t for advanced systems by 2030, with capture efficiencies of ~94–97% at design. Bankability rests on stacked incentives (e.g., tax credits), robust storage permitting, and balance‑of‑plant integration that preserves net output and water management. Risk shifts from core capture performance to integration: steam extraction, ductwork tie‑ins, grid services under capture operation, and solvent management/MRV.
What's Covered?
Report Summary
Key Takeaways
1) Advanced amines and water‑lean solvents reduce reboiler duty while maintaining ≥95% capture at design.
2) Standardized retrofit blocks (absorber/stripper, heat‑integration, reclaiming) cut cost and schedule risk.
3) Bankability requires firm storage access and transport; hubs and corridors de‑risk logistics.
4) Steam extraction, cooling water, and ductwork tie‑ins are integration chokepoints for power plants.
5) MRV and solvent management (degradation/foaming/corrosion) drive OPEX and reliability.
6) Outcome‑based EPC/O&M with energy‑per‑ton and availability KPIs aligns incentives.
7) Grid‑aware operations: capture units must ramp with power market needs without excessive penalties.
8) U.S. Gulf/Midwest and Alberta/Saskatchewan lead regional readiness; West/Northeast advance selectively.
Key Metrics
Market Size & Share
North American post‑combustion CCUS moves into a hub‑and‑corridor build‑out through 2030. In this illustrative view, cumulative capture capacity enabled by retrofits rises from ~13 to ~80 MtCO₂/yr across North America, with the USA scaling from ~10 to ~60 MtCO₂/yr. Power‑sector retrofits focus on coal and NGCC sites with viable steam extraction, cooling water, and flue‑gas tie‑in routes; industrial segments include cement, refineries, and boilers near storage hubs. Share consolidates around developers and utilities that secure storage access early, standardize capture blocks, and align operations with grid needs.
The U.S. Gulf anchors early share via pipeline corridors and saline formations; the Midwest leverages proximity to storage and industrial emitters; Canada’s Alberta and Saskatchewan contribute materially with established transport/storage systems; the U.S. Northeast and West advance where storage access and environmental constraints allow. As portfolios mature, multi‑plant programs and modular designs compress schedules and reduce per‑ton costs, increasing the addressable market for retrofits.

Market Analysis
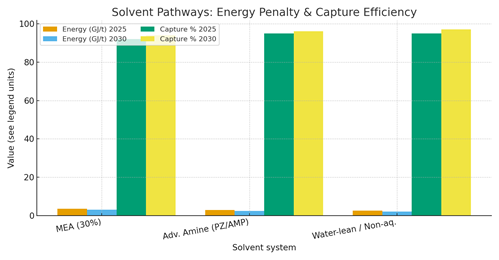
Solvent pathways define thermodynamics and OPEX. MEA sets the baseline (~3.2–3.6 GJ/t), while advanced amines (e.g., piperazine/AMP) and water‑lean/non‑aqueous systems reduce reboiler duty toward ~2.2–2.5 GJ/t by 2030 in this outlook, with design capture efficiencies of ~94–97%. Achievable performance depends on flue‑gas conditioning (SOx/NOx polishing, particulates), absorber packing, intercooling, lean vapor compression, and effective heat integration. Reliability hinges on solvent management oxidation, thermal degradation, corrosion and reclaiming systems sized for contaminants.
Project economics are sensitive to energy market spreads, water availability, auxiliary power, and outage impacts. Mitigations: early tie‑in engineering, compact absorber designs, and modular skids to minimize onsite work. Contracts are shifting to outcome KPIs: energy/ton, capture %, availability, and verified emissions. Plants with flexible operations co‑optimize capture loading with power market conditions, preserving revenue while meeting annualized capture targets.
Trends & Insights (2025–2030)
• Advanced amine and water‑lean solvents reduce reboiler duty and manage oxidative/thermal degradation with tailored inhibitors and reclaiming.
• Standardized absorber/stripper blocks with structured packing and intercooling improve turndown and footprint.
• Digital twins and plant‑wide optimization coordinate steam extraction, cooling, and capture loading vs power price.
• MRV by design: continuous analyzers, calibration, and data audit trails embedded from FEED to operations.
• Hub strategies: shared pipelines and storage hubs lower delivered cost and compress schedule risk.
• Hybrid decarbonization: CCUS pairs with efficiency uprates, fuel blending, and flexible operations for grid services.
• Water stewardship: cooled‑condensing and blowdown recovery balance added loads from capture units.
• Outcome‑based contracts with LDs/bonuses internalize performance (energy/ton, availability, emissions).
Segment Analysis
• Coal & Legacy Steam: large flue volumes and available steam favor initial retrofits where storage is proximate; prioritize corrosion control and SOx/NOx polishing.
• NGCC: lower CO₂ partial pressure increases absorber size/energy; advanced solvents and intercooling help; flexible capture loading aligns with market operations.
• Cement/Industrial Boilers: stable loads and high CO₂ fractions improve capture economics; integration with waste‑heat/utilities is key.
• Merchant/IPP vs Regulated Utilities: contract structures differ outcome‑based KPIs for IPPs vs cost‑of‑service recovery in regulated contexts.
Buyer guidance: select solvent by host constraints; secure storage and transport early; design for maintainability; and contract KPIs that align with grid/industrial operations.
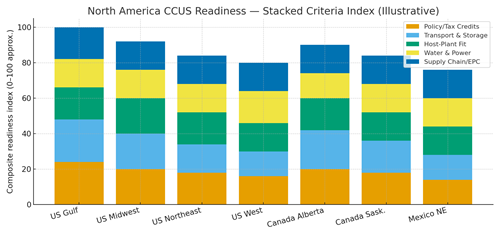
Geography Analysis (USA & North America)
Readiness concentrates in the U.S. Gulf (policy support, pipelines, saline storage) and the Midwest (industrial clusters, access to pore space). Alberta and Saskatchewan benefit from mature CO₂ transport and storage frameworks. The U.S. Northeast and West proceed selectively as storage access, permitting cadence, and water/power constraints are addressed. The stacked criteria policy/tax credits, transport & storage, host‑plant fit, water & power, supply chain/EPC show balanced ecosystems outperform single‑factor leaders.
Implications: prioritize hubs with firm storage and corridor rights; standardize retrofit blocks to shorten schedules; and harmonize outcome KPIs to enable vendor competition across regions.
Competitive Landscape (Ecosystem & Delivery Models)
Competition spans solvent licensors, absorber/stripper OEMs, EPC integrators, pipeline/storage developers, and MRV/data platforms. Differentiators: proven energy/ton performance, turndown flexibility, corrosion control, reclaiming efficiency, and bankable availability. Leaders deliver standardized retrofit blocks, integrate with transport/storage hubs, and offer outcome‑based EPC/O&M with verified MRV. Delivery models evolve toward programmatic portfolios: multiple plants share engineering, procurement, and spares, while financing leans on contracted storage capacity and performance guarantees. Players that align capture operations with grid/industrial realities and back it with measurable KPIs will capture North America’s CCUS retrofit wave through 2030.
Report Details
Proceed To Buy
Want a More Customized Experience?
- Request a Customized Transcript: Submit your own questions or specify changes. We’ll conduct a new call with the industry expert, covering both the original and your additional questions. You’ll receive an updated report for a small fee over the standard price.
- Request a Direct Call with the Expert: If you prefer a live conversation, we can facilitate a call between you and the expert. After the call, you’ll get the full recording, a verbatim transcript, and continued platform access to query the content and more.
68 Circular Road, #02-01 049422, Singapore
Revenue Tower, Scbd, Jakarta 12190, Indonesia
4th Floor, Pinnacle Business Park, Andheri East, Mumbai, 400093
Cinnabar Hills, Embassy Golf Links Business Park, Bengaluru, Karnataka 560071
Request Custom Transcript
Related Transcripts

$ 1445


$ 1345
$ 1432

68 Circular Road, #02-01 049422, Singapore
Revenue Tower, Scbd, No.52-53, Jakarta 12190, Indonesia
Cinnabar Hills, Embassy Golf Links Business Park, Bengaluru, Karnataka 560071
4th Floor, Pinnacle Business Park, Andheri East, Mumbai, 400093


68 Circular Road, #02-01 049422, Singapore
Revenue Tower, Scbd, Jakarta 12190, Indonesia
4th Floor, Pinnacle Business Park, Andheri East, Mumbai, 400093
Cinnabar Hills, Embassy Golf Links Business Park, Bengaluru, Karnataka 560071