Get in touch with us to learn more about our services, ask for assistance with a technical difficulty, or if you would like a product demo.
info@nextyn.com
Singapore
68 Circular Road, #02-01
049422, Singapore
Jakarta

Revenue Tower, Scbd, Jakarta 12190, Indonesia
Mumbai
4th Floor, Pinnacle Business Park, Andheri East, Mumbai, 400093
Bangalore

Cinnabar Hills, Embassy Golf Links Business Park, Bengaluru, Karnataka 560071
Twitter IconInstagram FaviconLinkedin Icon

Connect With Us

Thank you for submitting the form
Oops! Something went wrong while submitting the form.
Industry:
Energy, Sustainability & Environment

NEVI Federal Charging Program: Market Opportunity, Deployment Challenges & Revenue Models (2025–2030, U.S.)

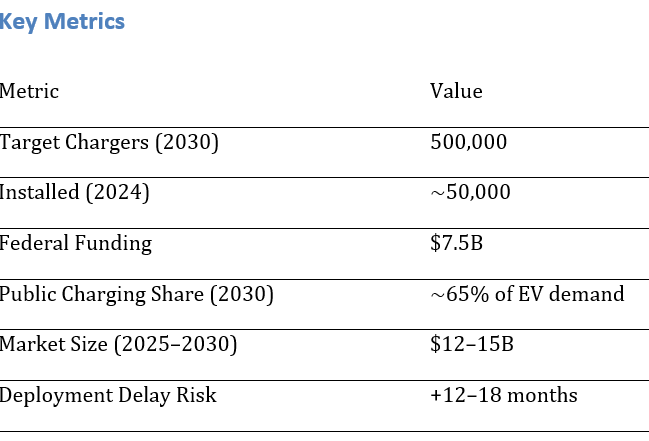
The $7.5 billion NEVI program is central to building the U.S. EV charging backbone, targeting 500,000 public chargers nationwide by 2030. While the opportunity is significant, deployment faces hurdles around permitting, grid upgrades, and viable business models. By 2030, over 65% of EV charging demand is expected to be met by public and semi-public infrastructure. This report analyzes market opportunity, challenges, and revenue pathways for stakeholders across the EV ecosystem.

A graphic showing Transcript IQ topical report
Category: 
Advanced
Insight Code: 
89F9R
Format: 
PDF / PPT / Excel
Deliverables: Primary Research Report + Infographic Pack

What's Covered?

What is the deployment outlook for NEVI chargers through 2030?
What is the market size and revenue opportunity for charging providers?
What permitting and interconnection challenges delay deployments?
How does NEVI funding interplay with state-level incentives?
Which regions will see the fastest charging rollout under NEVI?
What business/revenue models (subscription, fleet, pay-per-use) are emerging?
How concentrated will the provider landscape be by 2030?
What role do utilities and grid operators play in scaling NEVI chargers?
How do EV adoption rates correlate with NEVI deployment?
What risks could derail NEVI goals (supply chain, permitting, politics)?

Report Summary

1. Deployment Outlook (2024–2030)

The NEVI program targets 500,000 chargers by 2030, up from ~50,000 installed in 2024. Annual installations must accelerate to 75,000+ chargers per year between 2026–2030 to stay on track. Early deployments focus on interstate corridors, expanding later into urban centers and underserved regions.

2. Market Size & Revenue Opportunity

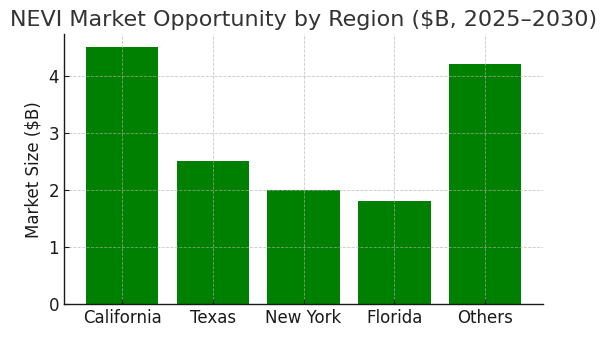
The NEVI program represents a $12–15B cumulative investment opportunity by 2030. California, Texas, New York, and Florida are expected to capture nearly 45% of the market due to large EV populations and highway networks. The Midwest and Southeast also offer high growth potential with federal matching funds accelerating adoption.

3. Permitting & Interconnection Challenges

Deployment is slowed by permitting bottlenecks and utility interconnection timelines, adding 12–18 months to project schedules. Permitting delays vary by state, with California averaging 14 months, while Texas and Midwest states are closer to 9–10 months. Federal coordination with utilities is critical to accelerate deployments.


4. State-Level Incentives Interplay

NEVI funding complements state programs like California’s CEC grants and New York’s NYSERDA incentives. State-level co-funding can cover up to 50% of project CAPEX, boosting ROI for developers. States with stronger programs will see faster NEVI rollouts, creating uneven adoption across the U.S.


5. Regional Rollout Dynamics

California, Texas, and New York lead early deployment, followed by Florida and Illinois. Rural and underserved areas are prioritized under NEVI’s equity mandate, ensuring nationwide corridor coverage by 2030. Deployment speed will hinge on utility grid readiness and local permitting efficiency.


6. Emerging Revenue Models

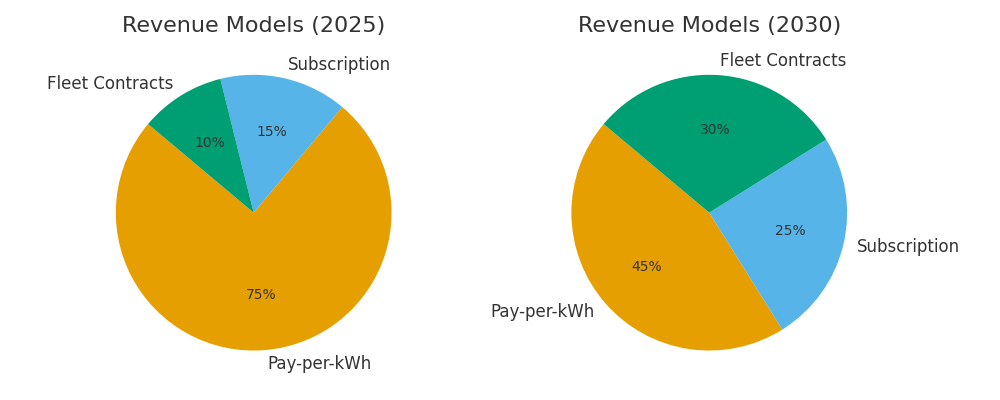
Charging providers are shifting from pure pay-per-kWh models to diversified revenue streams, including subscriptions, fleet contracts, and bundled services. By 2030, subscriptions and fleet charging are expected to represent ~55% of revenues, compared to <25% in 2025.

7. Provider Concentration

By 2030, the top five charging providers (Tesla, ChargePoint, EVgo, Electrify America, Blink) are projected to control over 60% of NEVI-funded sites. Market consolidation is expected as smaller players face scale disadvantages.

8. Role of Utilities & Grid Operators

Utilities are central to NEVI deployment, handling interconnection and grid upgrades. Peak load management, demand response, and renewable integration are key priorities. Grid investments of $20–25B will be required by 2030 to support charging demand.


9. EV Adoption Correlation

States with higher EV adoption rates (California, Washington, New York) align closely with NEVI rollout speed. By 2030, EV penetration is projected at 25–30% of new sales nationally, driving demand for corridor charging infrastructure.


10. Risks & Bottlenecks

Major risks include permitting delays, utility interconnection backlogs, supply chain shortages (chargers, transformers), and policy uncertainty post-2028. Addressing these bottlenecks is essential to achieving the 500,000-charger target by 2030.

Report Details

Last Updated: September 2025
Base Year: 2024
Estimated Years: 2025 - 2030

Proceed To Buy

Thank you! Your submission has been received!
Oops! Something went wrong while submitting the form.
Download Free PDF

Want a More Customized Experience?

  • Request a Customized Transcript: Submit your own questions or specify changes. We’ll conduct a new call with the industry expert, covering both the original and your additional questions. You’ll receive an updated report for a small fee over the standard price.
  • Request a Direct Call with the Expert: If you prefer a live conversation, we can facilitate a call between you and the expert. After the call, you’ll get the full recording, a verbatim transcript, and continued platform access to query the content and more.

Get in touch with us to learn more about our services, ask for assistance with a technical difficulty, or if you would like a product demo.
info@nextyn.com
Singapore
68 Circular Road, #02-01
049422, Singapore
Jakarta

Revenue Tower, Scbd, Jakarta 12190, Indonesia
Mumbai
4th Floor, Pinnacle Business Park, Andheri East, Mumbai, 400093
Bangalore

Cinnabar Hills, Embassy Golf Links Business Park, Bengaluru, Karnataka 560071
Twitter IconInstagram FaviconLinkedin Icon

Request Custom Transcript

Thank you for submitting the form
Oops! Something went wrong while submitting the form.

Related Transcripts

$ 1350

November 2025

Post-Combustion Carbon Capture, Utilization, and Storage (CCUS) Systems: Solvent-Based Systems & Power Plant Retrofits

Between 2025 and 2030, North American post‑combustion CCUS moves from demonstration to scaled deployment on coal and natural‑gas power plants, cement, and industrial boilers. The economic engine is solvent‑based capture paired with reliable transport and Class VI storage or EOR‑to‑storage transitions. Technology leadership consolidates around advanced amines (e.g., piperazine/AMP blends) and water‑lean/non‑aqueous solvents that cut reboiler duty while sustaining high capture rates and manageable degradation. Retrofit designs standardize: compact absorbers, high‑performance structured packing, lean‑rich heat integration, advanced reclaiming, and corrosion‑resistant metallurgy. Digital twins and plant‑wide optimization reduce parasitic load and ramping penalties. Illustratively, cumulative capture capacity addressed by post‑combustion retrofits in North America could grow from ~13 to ~80 MtCO₂/yr by 2030, with the USA rising from ~10 to ~60 MtCO₂/yr. Energy penalty trends decline from ~3.6 GJ/t (MEA) toward ~2.2–2.5 GJ/t for advanced systems by 2030, with capture efficiencies of ~94–97% at design. Bankability rests on stacked incentives (e.g., tax credits), robust storage permitting, and balance‑of‑plant integration that preserves net output and water management. Risk shifts from core capture performance to integration: steam extraction, ductwork tie‑ins, grid services under capture operation, and solvent management/MRV.

Carbon Capture
USA
North America

$ 1395

November 2025

LNG Storage Storage Infrastructure and Terminal Engineering: 9% Nickel Steel Adoption & Floating Regasification Units

From 2025 to 2030, North American LNG infrastructure pivots on two engineering vectors: the continued dominance of 9% nickel steel in onshore full‑containment tanks and the strategic use of floating storage and regasification units (FSRUs) to add rapid, modular capacity. 9% Ni steel remains the reference material for cryogenic service due to toughness at −196 °C, weldability, and long service life; learning curves, shop prefabrication, and automated welding drive incremental cost and schedule gains through 2030. In parallel, FSRUs compress time‑to‑market by leveraging converted LNG carriers or newbuilds, shifting capex to opex via charter models and enabling seasonal or transitional capacity. Illustratively, cumulative onshore storage additions rise from ~0.6 to ~2.9 million m³ between 2025 and 2030, while FSRU regas capacity scales from ~0.6 to ~4.0 bcf/d. Material selection remains a cost‑and‑schedule decision: 9% Ni steel benchmarks at an index of 100 in 2025 for both cost and lead time; alternatives such as 304L stainless and aluminum alloys carry higher indices today, with moderate convergence by 2030 as supply chains deepen. Risk management focuses on cold box metallurgy, weld QA/QC, and foundation/settlement control for full‑containment tanks; for FSRUs, interface risks dominate (mooring, cryogenic transfer arms, send‑out pressure control) along with marine permitting and hurricane resilience.

Oil & Gas Storage & Transportation
USA
North America

$ 1395

November 2025

Environmental Consulting and Sustainability Management Frameworks: ESG Compliance & Supply Chain Decarbonization Strategies

From 2025 to 2030, North American organizations will navigate a step-change in sustainability management as disclosure requirements expand, supplier expectations tighten, and capital markets reward credible transition plans. The consulting and services market unites three engines of demand: (1) ESG compliance and disclosure across multiple frameworks; (2) supply‑chain decarbonization with granular product and site‑level data; and (3) data platforms and MRV automation that convert sustainability workflows into auditable, repeatable processes. Enterprises are moving beyond one‑off reports toward integrated operating systems that connect finance, procurement, operations, and IT. The winners will operationalize governance, embed decarbonization into sourcing and capex, and instrument supply chains with verifiable data flows. Compliance sets the floor. Public companies confront rising expectations for greenhouse‑gas accounting, climate risk, and sustainability governance; private firms feel pull-through from customers, lenders, and insurers. Meanwhile, supply‑chain decarbonization becomes the cost‑effective frontier: category‑level roadmaps, supplier segmentation, and performance‑based contracts reduce emissions per unit cost. Service providers that pair strategy with execution target setting, data architecture, vendor enablement, and financing unlock durable value.

Environmental Consulting
USA
North America

$ 1450

November 2025
Get in touch with us to learn more about our services, ask for assistance with a technical difficulty, or if you would like a product demo.
info@nextyn.com
Singapore
68 Circular Road, #02-01
049422, Singapore
Jakarta

Revenue Tower, Scbd, Jakarta 12190, Indonesia
Mumbai
4th Floor, Pinnacle Business Park, Andheri East, Mumbai, 400093
Bangalore

Cinnabar Hills, Embassy Golf Links Business Park, Bengaluru, Karnataka 560071
Twitter IconInstagram FaviconLinkedin Icon

Buy Now

Thank you for submitting the form
Oops! Something went wrong while submitting the form.