Get in touch with us to learn more about our services, ask for assistance with a technical difficulty, or if you would like a product demo.
info@nextyn.com
Singapore
68 Circular Road, #02-01
049422, Singapore
Jakarta

Revenue Tower, Scbd, Jakarta 12190, Indonesia
Mumbai
4th Floor, Pinnacle Business Park, Andheri East, Mumbai, 400093
Bangalore

Cinnabar Hills, Embassy Golf Links Business Park, Bengaluru, Karnataka 560071
Twitter IconInstagram FaviconLinkedin Icon

Connect With Us

Thank you for submitting the form
Oops! Something went wrong while submitting the form.
Industry:
Energy, Sustainability & Environment

NACS Connector Revolution (SAE J3400): Infrastructure Economics, OEM Strategy & Regulatory Alignment (2025–2030)

The adoption of NACS (SAE J3400) as the unified charging standard in the U.S. is reshaping the EV ecosystem. By 2030, over 80% of new EVs sold in North America are expected to be NACS-compatible, driving infrastructure consolidation and lowering TCO for operators. This report explores infrastructure economics, OEM strategies, and regulatory alignment shaping the transition from fragmented charging standards to a nationwide interoperable system.

A graphic showing Transcript IQ topical report
Category: 
Advanced
Insight Code: 
94G5T
Format: 
PDF / PPT / Excel
Deliverables: Primary Research Report + Infographic Pack

What's Covered?

What is the projected adoption rate of NACS among new EVs by 2030?
How does Tesla’s Supercharger network shape the NACS rollout?
What are the infrastructure economics of converting CCS to NACS?
Which OEMs are committing to NACS and on what timeline?
How does NACS affect interoperability and consumer adoption?
What regulatory alignment is required at the federal and state levels?
What impact does NACS standardization have on charging TCO and ROI?
How does the shift affect independent charging operators vs. OEM-backed networks?
What risks exist if adoption is uneven across geographies or OEMs?
What does the 2025–2030 roadmap look like for full regulatory and industry alignment?

Report Summary

1. NACS Adoption Rate (2024–2030)

By 2030, over 80% of new EVs sold in North America will be NACS-compatible. The transition begins with Ford and GM in 2025, followed by VW and Toyota by 2026. Tesla’s early dominance accelerates standardization and consumer adoption.

2. Tesla’s Supercharger Network

Tesla’s Supercharger network is expected to account for ~55% of public fast-charging capacity by 2026. Its decision to open NACS to competitors set the foundation for industry-wide adoption. Partnerships with Ford, GM, and Rivian expand access while maintaining Tesla’s first-mover advantage.

3. Economics of Retrofitting CCS to NACS

Retrofitting existing CCS chargers to NACS will cost $2–4B between 2025–2030. Each retrofit costs ~$5,000–$8,000 per charger, but consolidation reduces hardware duplication. Overall, operators achieve 10–15% cost savings due to standardized equipment.

4. OEM Commitments & Timelines

Ford, GM, Rivian, and Hyundai have announced NACS adoption starting 2025, while VW and Toyota plan to align by 2026. This collective shift ensures over 80% of new EVs in North America will adopt NACS by 2030.

5. Interoperability & Consumer Adoption

NACS reduces charging anxiety by offering a single connector type across most EVs. Interoperability improves charging station utilization by 15–20% and accelerates consumer adoption, particularly in suburban and rural areas.

6. Federal & State Alignment

The FHWA and DOE require NEVI-funded charging projects after 2025 to include NACS. State-level energy commissions in California, Texas, and New York have already issued guidelines mandating dual compatibility with CCS and NACS until 2027.

7. Impact on Charging TCO & ROI

Standardization under NACS reduces per-charger equipment and maintenance costs by 10–15%. Operators achieve higher ROI through better utilization and reduced redundancy in multi-standard hardware.

8. Impact on Independent Operators

Independent charging operators may face higher upfront retrofit costs compared to OEM-backed networks. However, improved interoperability increases utilization rates and revenue potential, offsetting the initial expenses.

9. Risks of Uneven Adoption

If some OEMs or regions delay adoption, interoperability could suffer. Canada is expected to align by 2027, but Mexico may lag until 2029. Fragmentation risks persist if global standards diverge (e.g., CCS in EU vs NACS in U.S.).

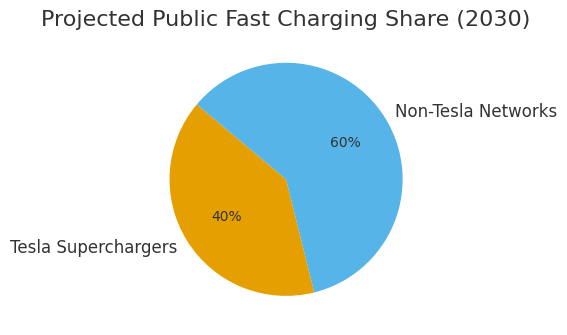
10. Roadmap for 2025–2030 Alignment

By 2030, Tesla’s share of public fast charging will decline from 55% to ~40% as non-Tesla networks scale under NACS. This creates a more balanced and competitive charging ecosystem, ensuring universal compatibility for EV drivers.

Key Takeaways

• By 2030, 80%+ of new EVs in North America will support NACS.

• Tesla’s Supercharger network to represent ~55% of public fast charging capacity by 2026.

• Retrofitting CCS sites to NACS expected to cost $2–4B cumulatively (2025–2030).

• OEM commitments: Ford, GM, Rivian, and Hyundai already aligned; VW and Toyota finalizing by 2026.

• Regulatory alignment: FHWA & DOE mandating NACS interoperability for NEVI funds post-2025.

• Infrastructure cost savings of 10–15% per charger due to standardization.

Report Details

Last Updated: September 2025
Base Year: 2024
Estimated Years: 2025 - 2030

Proceed To Buy

Thank you! Your submission has been received!
Oops! Something went wrong while submitting the form.
Download Free PDF

Want a More Customized Experience?

  • Request a Customized Transcript: Submit your own questions or specify changes. We’ll conduct a new call with the industry expert, covering both the original and your additional questions. You’ll receive an updated report for a small fee over the standard price.
  • Request a Direct Call with the Expert: If you prefer a live conversation, we can facilitate a call between you and the expert. After the call, you’ll get the full recording, a verbatim transcript, and continued platform access to query the content and more.

Get in touch with us to learn more about our services, ask for assistance with a technical difficulty, or if you would like a product demo.
info@nextyn.com
Singapore
68 Circular Road, #02-01
049422, Singapore
Jakarta

Revenue Tower, Scbd, Jakarta 12190, Indonesia
Mumbai
4th Floor, Pinnacle Business Park, Andheri East, Mumbai, 400093
Bangalore

Cinnabar Hills, Embassy Golf Links Business Park, Bengaluru, Karnataka 560071
Twitter IconInstagram FaviconLinkedin Icon

Request Custom Transcript

Thank you for submitting the form
Oops! Something went wrong while submitting the form.

Related Transcripts

$ 1350

November 2025

Post-Combustion Carbon Capture, Utilization, and Storage (CCUS) Systems: Solvent-Based Systems & Power Plant Retrofits

Between 2025 and 2030, North American post‑combustion CCUS moves from demonstration to scaled deployment on coal and natural‑gas power plants, cement, and industrial boilers. The economic engine is solvent‑based capture paired with reliable transport and Class VI storage or EOR‑to‑storage transitions. Technology leadership consolidates around advanced amines (e.g., piperazine/AMP blends) and water‑lean/non‑aqueous solvents that cut reboiler duty while sustaining high capture rates and manageable degradation. Retrofit designs standardize: compact absorbers, high‑performance structured packing, lean‑rich heat integration, advanced reclaiming, and corrosion‑resistant metallurgy. Digital twins and plant‑wide optimization reduce parasitic load and ramping penalties. Illustratively, cumulative capture capacity addressed by post‑combustion retrofits in North America could grow from ~13 to ~80 MtCO₂/yr by 2030, with the USA rising from ~10 to ~60 MtCO₂/yr. Energy penalty trends decline from ~3.6 GJ/t (MEA) toward ~2.2–2.5 GJ/t for advanced systems by 2030, with capture efficiencies of ~94–97% at design. Bankability rests on stacked incentives (e.g., tax credits), robust storage permitting, and balance‑of‑plant integration that preserves net output and water management. Risk shifts from core capture performance to integration: steam extraction, ductwork tie‑ins, grid services under capture operation, and solvent management/MRV.

Carbon Capture
USA
North America

$ 1395

November 2025

LNG Storage Storage Infrastructure and Terminal Engineering: 9% Nickel Steel Adoption & Floating Regasification Units

From 2025 to 2030, North American LNG infrastructure pivots on two engineering vectors: the continued dominance of 9% nickel steel in onshore full‑containment tanks and the strategic use of floating storage and regasification units (FSRUs) to add rapid, modular capacity. 9% Ni steel remains the reference material for cryogenic service due to toughness at −196 °C, weldability, and long service life; learning curves, shop prefabrication, and automated welding drive incremental cost and schedule gains through 2030. In parallel, FSRUs compress time‑to‑market by leveraging converted LNG carriers or newbuilds, shifting capex to opex via charter models and enabling seasonal or transitional capacity. Illustratively, cumulative onshore storage additions rise from ~0.6 to ~2.9 million m³ between 2025 and 2030, while FSRU regas capacity scales from ~0.6 to ~4.0 bcf/d. Material selection remains a cost‑and‑schedule decision: 9% Ni steel benchmarks at an index of 100 in 2025 for both cost and lead time; alternatives such as 304L stainless and aluminum alloys carry higher indices today, with moderate convergence by 2030 as supply chains deepen. Risk management focuses on cold box metallurgy, weld QA/QC, and foundation/settlement control for full‑containment tanks; for FSRUs, interface risks dominate (mooring, cryogenic transfer arms, send‑out pressure control) along with marine permitting and hurricane resilience.

Oil & Gas Storage & Transportation
USA
North America

$ 1395

November 2025

Environmental Consulting and Sustainability Management Frameworks: ESG Compliance & Supply Chain Decarbonization Strategies

From 2025 to 2030, North American organizations will navigate a step-change in sustainability management as disclosure requirements expand, supplier expectations tighten, and capital markets reward credible transition plans. The consulting and services market unites three engines of demand: (1) ESG compliance and disclosure across multiple frameworks; (2) supply‑chain decarbonization with granular product and site‑level data; and (3) data platforms and MRV automation that convert sustainability workflows into auditable, repeatable processes. Enterprises are moving beyond one‑off reports toward integrated operating systems that connect finance, procurement, operations, and IT. The winners will operationalize governance, embed decarbonization into sourcing and capex, and instrument supply chains with verifiable data flows. Compliance sets the floor. Public companies confront rising expectations for greenhouse‑gas accounting, climate risk, and sustainability governance; private firms feel pull-through from customers, lenders, and insurers. Meanwhile, supply‑chain decarbonization becomes the cost‑effective frontier: category‑level roadmaps, supplier segmentation, and performance‑based contracts reduce emissions per unit cost. Service providers that pair strategy with execution target setting, data architecture, vendor enablement, and financing unlock durable value.

Environmental Consulting
USA
North America

$ 1450

November 2025
Get in touch with us to learn more about our services, ask for assistance with a technical difficulty, or if you would like a product demo.
info@nextyn.com
Singapore
68 Circular Road, #02-01
049422, Singapore
Jakarta

Revenue Tower, Scbd, Jakarta 12190, Indonesia
Mumbai
4th Floor, Pinnacle Business Park, Andheri East, Mumbai, 400093
Bangalore

Cinnabar Hills, Embassy Golf Links Business Park, Bengaluru, Karnataka 560071
Twitter IconInstagram FaviconLinkedin Icon

Buy Now

Thank you for submitting the form
Oops! Something went wrong while submitting the form.