

68 Circular Road, #02-01 049422, Singapore
Revenue Tower, Scbd, Jakarta 12190, Indonesia
4th Floor, Pinnacle Business Park, Andheri East, Mumbai, 400093
Cinnabar Hills, Embassy Golf Links Business Park, Bengaluru, Karnataka 560071


Connect With Us


68 Circular Road, #02-01 049422, Singapore
Revenue Tower, Scbd, Jakarta 12190, Indonesia
4th Floor, Pinnacle Business Park, Andheri East, Mumbai, 400093
Cinnabar Hills, Embassy Golf Links Business Park, Bengaluru, Karnataka 560071
Connect With Us
68 Circular Road, #02-01 049422, Singapore
Revenue Tower, Scbd, Jakarta 12190, Indonesia
4th Floor, Pinnacle Business Park, Andheri East, Mumbai, 400093
Cinnabar Hills, Embassy Golf Links Business Park, Bengaluru, Karnataka 560071
Request Custom Transcript
LNG Storage Storage Infrastructure and Terminal Engineering: 9% Nickel Steel Adoption & Floating Regasification Units
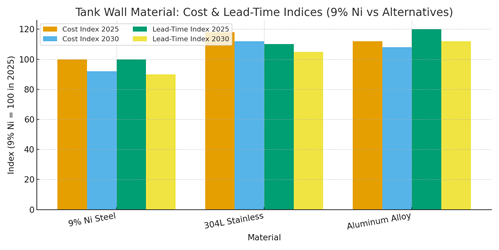
From 2025 to 2030, North American LNG infrastructure pivots on two engineering vectors: the continued dominance of 9% nickel steel in onshore full‑containment tanks and the strategic use of floating storage and regasification units (FSRUs) to add rapid, modular capacity. 9% Ni steel remains the reference material for cryogenic service due to toughness at −196 °C, weldability, and long service life; learning curves, shop prefabrication, and automated welding drive incremental cost and schedule gains through 2030. In parallel, FSRUs compress time‑to‑market by leveraging converted LNG carriers or newbuilds, shifting capex to opex via charter models and enabling seasonal or transitional capacity. Illustratively, cumulative onshore storage additions rise from ~0.6 to ~2.9 million m³ between 2025 and 2030, while FSRU regas capacity scales from ~0.6 to ~4.0 bcf/d. Material selection remains a cost‑and‑schedule decision: 9% Ni steel benchmarks at an index of 100 in 2025 for both cost and lead time; alternatives such as 304L stainless and aluminum alloys carry higher indices today, with moderate convergence by 2030 as supply chains deepen. Risk management focuses on cold box metallurgy, weld QA/QC, and foundation/settlement control for full‑containment tanks; for FSRUs, interface risks dominate (mooring, cryogenic transfer arms, send‑out pressure control) along with marine permitting and hurricane resilience.
What's Covered?
Report Summary
Key Takeaways
1) 9% Ni steel remains the reference for full‑containment tanks; alternatives narrow cost gaps by 2030.
2) FSRUs add rapid, modular regas capacity, converting capex to opex via charter structures.
3) Cumulative onshore storage may approach ~2.9 million m³; FSRU send‑out ~4.0 bcf/d by 2030 (illustrative).
4) Critical risks: weld QA/QC, foundations, and BOG management onshore; mooring/transfer interfaces offshore.
5) Gulf Coast leads readiness; East advances via brownfields; West faces slower permitting.
6) Outcome‑based EPC and charter contracts with energy/uptime warranties improve bankability.
7) Automation and shop‑fabrication reduce cost and schedule variance for 9% Ni tanks.
8) Grid/gas interconnect and hurricane resilience planning are decisive for reliable operations.
Key Metrics

Market Size & Share
North America’s LNG infrastructure build‑out centers on onshore full‑containment tanks paired with flexible FSRU deployments. In this illustrative outlook, cumulative onshore storage additions rise from ~600 to ~2,900 thousand m³ between 2025 and 2030, while FSRU send‑out capacity scales from ~0.6 to ~4.0 bcf/d. Gulf Coast projects anchor share due to existing terminals, fabrication ecosystems, and pipeline egress; East Coast brownfields and power‑market needs support incremental tanks and occasional FSRU tie‑ins; West Coast growth is constrained by permitting cadence and stakeholder processes. Share dynamics hinge on time‑to‑market and interconnectivity. FSRUs capture early‑stage demand and contingency supply where grid/gas links are proximate, while onshore tanks dominate long‑term baseload with lower lifetime energy and maintenance costs. 9% Ni steel remains the de facto choice for primary and secondary containments given cryogenic performance and mature QA/QC regimes, though aluminum and austenitic stainless variants appear in niche or schedule‑driven cases. By 2030, standardization of tank module sizes and pre‑engineered FSRU interface packages allow faster expansions and portfolio optimization.

Market Analysis
Material selection is a composite of cost, schedule, and risk. Indexed to 9% Ni steel at 100 in 2025, 304L stainless and aluminum alloys carry higher cost and lead‑time indices due to supply chains and fabrication complexity; moderate convergence by 2030 reflects automation and vendor depth. For tanks, critical drivers are weld quality (procedure qualification, NDE coverage), thermal contraction management, foundation/settlement, and boil‑off gas (BOG) handling. For FSRUs, mooring dynamics, cryogenic transfer systems, and send‑out pressure control dictate availability and energy use. Economically, FSRUs excel for rapid deployment and transitional capacity capex‑light via charters but carry higher opex per unit send‑out vs onshore baseload. Onshore tanks require larger up‑front capex yet deliver lower lifetime energy and maintenance costs. Sensitivities include commodity price indices (plate, nickel), yard/fabrication slots, permitting duration, and weather/insurance assumptions (hurricane/seismic). Risk mitigations: pre‑invested foundations, modularized topsides, dual‑fuel or grid‑connected utilities, and outcome‑based contracts with send‑out/energy/uptime warranties and LDs.
Trends & Insights (2025–2030)
• Standardization: repeatable tank modules and FSRU interface packages compress schedules and reduce cost variance.
• Automation: automated welding, digital radiography/UT, and robotic inspection improve QA/QC and safety.
• Digital twins: integrity and BOG management optimize operations; predictive maintenance reduces downtime.
• Hybrid portfolios: onshore baseload + FSRU seasonal/contingency capacity for market flexibility.
• Energy efficiency: recondenser optimization, subcooling, variable‑speed drives, and waste‑heat recovery lower kWh/ton.
• Resilience: hurricane moorings, quick‑release hooks, seismic base isolation where needed; power redundancy.
• Contracting: outcome‑based EPC and charter terms with performance testing and MRV embedded.
• Supply chain depth: additional 9% Ni plate and cryogenic equipment vendors reduce bottlenecks by 2030.
Segment Analysis
• Power & Utilities: FSRUs enable seasonal peaking and contingency; onshore tanks serve baseload LNG‑to‑power or peak‑shaving.
• Gas/LNG Traders: flexible regas capacity supports portfolio optionality and arbitrage; onshore storage enables operational blending and inventory.
• Industrial off‑takers: petrochemicals and industry secure firm send‑out via onshore baseload; FSRUs bridge construction phases.
• Ports/Authorities: prioritize interface safety, navigation, and environmental permitting; resilience planning for extreme weather.
Buyer guidance: define baseload vs contingency needs; select material/technology by schedule and lifecycle cost; lock fabrication slots; require performance warranties (send‑out, energy, uptime); and plan phased expansions (pre‑invest foundations, add tanks or second FSRU).
Geography Analysis (USA & North America)
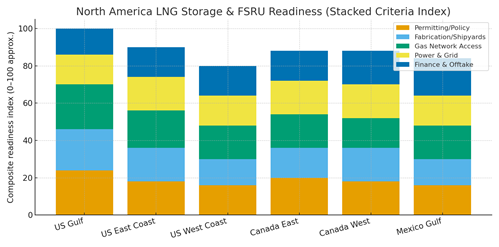
Readiness is highest along the U.S. Gulf due to fabrication depth, pipeline access, and offtake optionality. The East Coast advances via brownfield terminals and power‑market needs; the West Coast is shaped by permitting cadence and stakeholder processes. Canada’s East/West corridors progress with industrial demand and power access, while Mexico’s Gulf sees opportunities where industrial growth and cross‑border flows align. The stacked criteria (permitting/policy, fabrication/shipyards, gas network access, power/grid, finance/offtake) reveal complementary strengths across regions.
Implications: site early where interconnects are shortest and permitting is predictable; use FSRUs to cover near‑term needs and seasonal peaks; and sequence onshore baseload tanks for long‑term cost efficiency. Embed resilience (weather/seismic) and MRV for energy and BOG in all cases.
Competitive Landscape (Ecosystem & Delivery Models)
Competitors span tank EPCs, cryogenic equipment OEMs, shipyards/FSRU lessors, and digital/MRV providers. Differentiators: weld quality and automation, cold box metallurgy and supply chain depth, interface engineering for FSRUs, and verified performance (send‑out, energy/ton, uptime). Contracting shifts toward outcome‑based EPC and charter models with performance warranties and LDs; banks value proven track records and digital MRV for operations. Strategic plays include pre‑invested civil works for phased tanks, tie‑in ready pipeline/gas grid interfaces, and hybrid portfolios (baseload onshore + FSRU optionality). Vendors that combine engineering depth, schedule reliability, and performance‑linked service models will take share through 2030.
Report Details
Proceed To Buy
Want a More Customized Experience?
- Request a Customized Transcript: Submit your own questions or specify changes. We’ll conduct a new call with the industry expert, covering both the original and your additional questions. You’ll receive an updated report for a small fee over the standard price.
- Request a Direct Call with the Expert: If you prefer a live conversation, we can facilitate a call between you and the expert. After the call, you’ll get the full recording, a verbatim transcript, and continued platform access to query the content and more.
68 Circular Road, #02-01 049422, Singapore
Revenue Tower, Scbd, Jakarta 12190, Indonesia
4th Floor, Pinnacle Business Park, Andheri East, Mumbai, 400093
Cinnabar Hills, Embassy Golf Links Business Park, Bengaluru, Karnataka 560071
Request Custom Transcript
Related Transcripts
$ 1445

$ 1345
$ 1432

68 Circular Road, #02-01 049422, Singapore
Revenue Tower, Scbd, No.52-53, Jakarta 12190, Indonesia
Cinnabar Hills, Embassy Golf Links Business Park, Bengaluru, Karnataka 560071
4th Floor, Pinnacle Business Park, Andheri East, Mumbai, 400093


68 Circular Road, #02-01 049422, Singapore
Revenue Tower, Scbd, Jakarta 12190, Indonesia
4th Floor, Pinnacle Business Park, Andheri East, Mumbai, 400093
Cinnabar Hills, Embassy Golf Links Business Park, Bengaluru, Karnataka 560071