

68 Circular Road, #02-01 049422, Singapore
Revenue Tower, Scbd, Jakarta 12190, Indonesia
4th Floor, Pinnacle Business Park, Andheri East, Mumbai, 400093
Cinnabar Hills, Embassy Golf Links Business Park, Bengaluru, Karnataka 560071


Connect With Us


68 Circular Road, #02-01 049422, Singapore
Revenue Tower, Scbd, Jakarta 12190, Indonesia
4th Floor, Pinnacle Business Park, Andheri East, Mumbai, 400093
Cinnabar Hills, Embassy Golf Links Business Park, Bengaluru, Karnataka 560071
Connect With Us
68 Circular Road, #02-01 049422, Singapore
Revenue Tower, Scbd, Jakarta 12190, Indonesia
4th Floor, Pinnacle Business Park, Andheri East, Mumbai, 400093
Cinnabar Hills, Embassy Golf Links Business Park, Bengaluru, Karnataka 560071
Request Custom Transcript
Lithium Supply Crisis vs. Battery Recycling Revolution: Circular Economy, Competitive Landscape & Regulatory Push(2025-2030)
Global lithium demand rose nearly 30% in 2024 and is projected to triple by 2030, driven by EVs and grid storage. Supply remains concentrated in Australia, Chile, and China, exposing markets to volatility and geopolitical risks. Battery recycling, expected to contribute 15–25% of demand by 2030, is emerging as a key stabilizer. This report explores supply constraints, recycling advances, regulatory pushes, and strategic implications shaping the lithium economy.
What's Covered?
Report Summary
1. Lithium Demand Growth Outlook
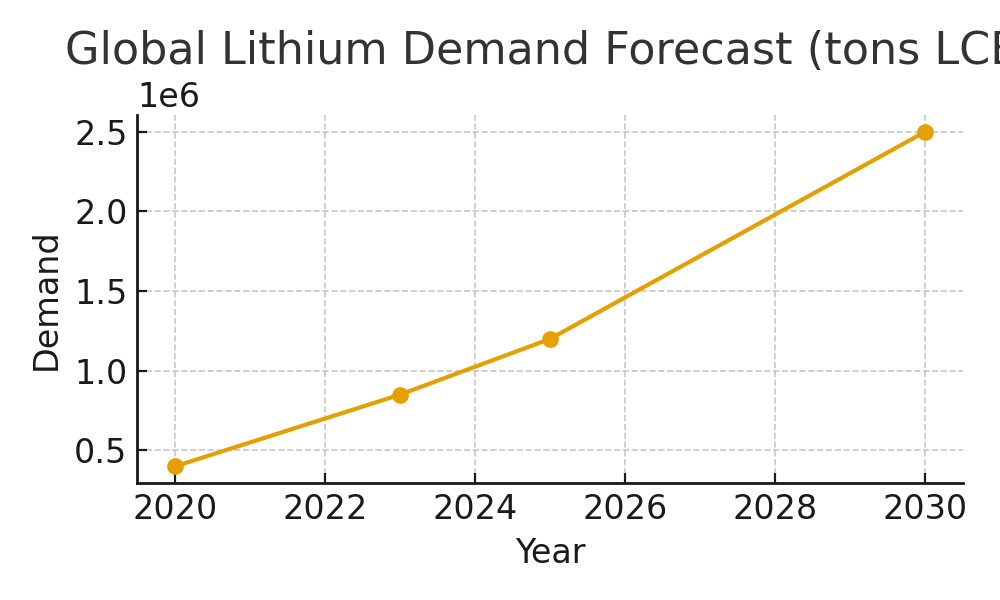
Global lithium demand is on a steep trajectory. From ~400,000 tons LCE in 2020, demand doubled to ~850,000 tons by 2023. By 2030, it is forecast to reach ~2.5M tons. EVs remain the largest driver, requiring 8–10 kg of lithium per vehicle, while grid-scale storage adds incremental pressure. Despite planned mines in Africa and Canada, long development timelines mean supply will remain tight. Recycling and demand efficiency will be crucial stabilizers.
2. Regional Mining Landscape & Geopolitical Risk
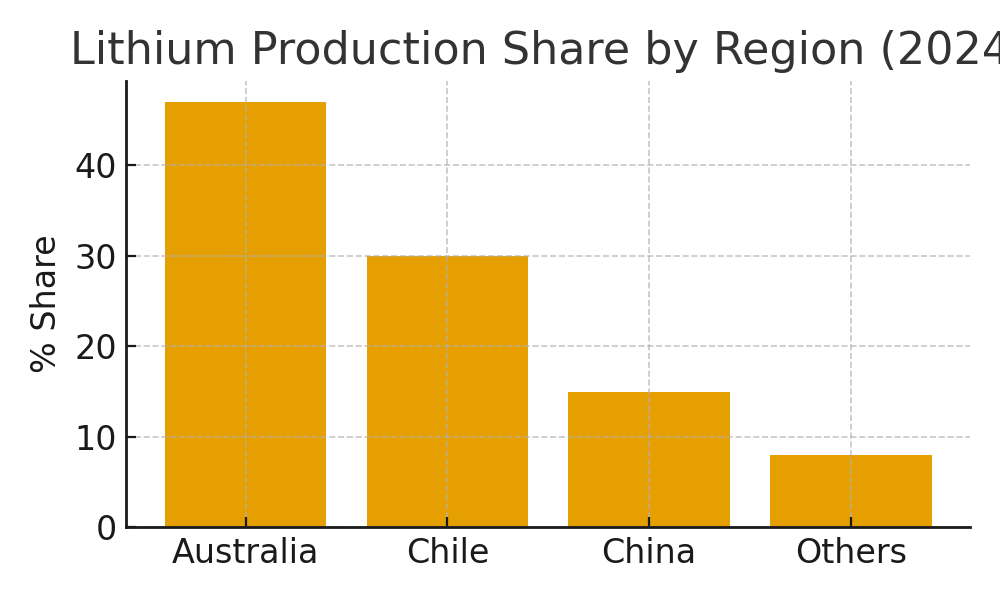
Lithium production is highly concentrated: Australia holds ~47% share, Chile ~30%, and China ~15%. This concentration creates risks ranging from Chile’s resource nationalism to China’s dominance in refining (>60% global capacity). Latin America faces additional hurdles from permitting delays and community opposition. Western governments are responding with funding and the EU Critical Raw Materials Act, but execution will take years. Near-term supply remains vulnerable to geopolitics and environmental disputes.
3. EV Adoption and Demand Impact
EVs are the dominant driver of lithium demand. Global EV sales hit ~14M in 2023 and are expected to surpass 40M annually by 2030. Each EV battery requires 40–60 kg of LCE depending on chemistry. China leads with ~60% of global sales, followed by Europe and the U.S. Aggressive emissions mandates and OEM phase-out commitments fuel growth. Electrification of fleets, buses, and two-wheelers in emerging markets will further strain supply.
4. Recycling Share in Supply Mix
Recycling is emerging as a critical buffer. In 2025, recycled lithium will supply <10% of global demand, but by 2030 this could rise to 20–25%. Hydrometallurgy and direct recycling are improving recovery yields, while regulatory frameworks mandate higher recycling quotas. As end-of-life batteries grow in volume, recyclers can secure meaningful supply. This shift could reduce dependence on mining, stabilize costs, and cut carbon intensity in the value chain.

5. Emerging Recycling Technologies
Hydrometallurgical processes dominate due to higher yields and controllable recovery rates. Direct recycling (cathode-to-cathode) is gaining traction for cost and energy efficiency, while pyrometallurgy remains relevant for mixed or contaminated feedstocks. Technology choice depends on chemistry, scale, and purity targets. The biggest hurdle is economics—direct recycling requires innovation at industrial scale, while hydrometallurgy faces energy intensity issues. Advancements in sorting, preprocessing, and modular plants are expected to improve viability.
6. Cost Comparison: Virgin Mining vs Recycling
Virgin lithium mining is capital-heavy, environmentally taxing, and slow to scale. Recycling offers 15–20% cost savings when factoring in logistics and refining costs. While recycling requires upfront plant investment, ongoing operational costs are lower and less exposed to geopolitical risks. Virgin extraction carries high energy and water use, while recycling reduces emissions and energy intensity. A dual-path strategy is expected: mining for new supply, recycling for long-term stability.
7. Regulatory Frameworks
Policy frameworks are accelerating the recycling shift. The EU Battery Regulation mandates recycling quotas and introduces battery passports. The U.S. has rolled out Extended Producer Responsibility (EPR), requiring OEMs to manage end-of-life batteries. China, already dominant in refining, is mandating traceability and high recovery rates. These policies are forcing automakers and suppliers to invest in closed-loop systems, creating compliance-driven demand for recycling infrastructure and reshaping supply contracts globally.
8. Challenges in Scaling Recycling Infrastructure
Despite optimism, scaling recycling is complex. Challenges include securing consistent feedstock, sorting diverse chemistries, achieving purity standards, and financing high-capex projects. Many plants struggle with throughput efficiency. Logistics of collecting, transporting, and storing end-of-life batteries add costs. Regulatory approvals and community opposition to new facilities further delay scaling. Without coordinated investment and policy support, recycling will fall short of its potential contribution by 2030.
9. OEM & Gigafactory Closed-Loop Strategies
OEMs are integrating recycling into supply chains to reduce volatility. Tesla, CATL, and European automakers have announced closed-loop partnerships with recyclers. Gigafactories increasingly co-locate recycling units to minimize logistics costs and secure raw materials. By 2030, closed-loop ecosystems could supply 20–30% of their lithium needs internally. This model reduces cost exposure, strengthens ESG credentials, and aligns with regulatory compliance. The strategy is becoming a key differentiator in the competitive EV landscape.
10. Lithium Price Volatility
Lithium prices have been highly unstable. After surging in 2021–2022, prices collapsed ~80% by 2024. Supply-demand imbalances, speculation, and regulatory actions all contribute. Recycling offers a stabilizing effect by smoothing supply and reducing dependence on volatile mining markets. Analysts expect continued volatility, but greater recycling penetration could dampen extreme swings by 2030. Investors must plan for cyclical pricing but recognize recycling as a structural hedge.
11. End-of-Life Battery Volumes & Recovery Potential
By 2030, ~1.3M tons of EV batteries are expected to reach end-of-life annually, with the U.S. and Europe accounting for nearly half. This represents a significant feedstock for recyclers, enabling scale-up of circular supply. However, collection systems and logistics remain fragmented. Companies that secure feedstock contracts early will hold competitive advantages. This volume also raises safety and environmental considerations, underscoring the urgency of robust recycling infrastructure.

12. Investment Outlook: Mining vs Recycling
Mining remains essential, but recycling is rapidly becoming a growth frontier. Investors are diversifying exposure—some backing traditional miners in Latin America and Africa, others focusing on recycling startups in Europe, the U.S., and Asia. Recycling offers faster scaling potential, lower geopolitical risk, and stronger ESG credentials. Strategic investments via joint ventures, acquisitions, and vertical integration are expected to define the competitive landscape. Long-term, mining and recycling will be complementary, not competing, pillars of the lithium economy.
Report Details
Proceed To Buy
Want a More Customized Experience?
- Request a Customized Transcript: Submit your own questions or specify changes. We’ll conduct a new call with the industry expert, covering both the original and your additional questions. You’ll receive an updated report for a small fee over the standard price.
- Request a Direct Call with the Expert: If you prefer a live conversation, we can facilitate a call between you and the expert. After the call, you’ll get the full recording, a verbatim transcript, and continued platform access to query the content and more.
68 Circular Road, #02-01 049422, Singapore
Revenue Tower, Scbd, Jakarta 12190, Indonesia
4th Floor, Pinnacle Business Park, Andheri East, Mumbai, 400093
Cinnabar Hills, Embassy Golf Links Business Park, Bengaluru, Karnataka 560071
Request Custom Transcript
Related Transcripts

68 Circular Road, #02-01 049422, Singapore
Revenue Tower, Scbd, No.52-53, Jakarta 12190, Indonesia
Cinnabar Hills, Embassy Golf Links Business Park, Bengaluru, Karnataka 560071
4th Floor, Pinnacle Business Park, Andheri East, Mumbai, 400093


68 Circular Road, #02-01 049422, Singapore
Revenue Tower, Scbd, Jakarta 12190, Indonesia
4th Floor, Pinnacle Business Park, Andheri East, Mumbai, 400093
Cinnabar Hills, Embassy Golf Links Business Park, Bengaluru, Karnataka 560071