

68 Circular Road, #02-01 049422, Singapore
Revenue Tower, Scbd, Jakarta 12190, Indonesia
4th Floor, Pinnacle Business Park, Andheri East, Mumbai, 400093
Cinnabar Hills, Embassy Golf Links Business Park, Bengaluru, Karnataka 560071


Connect With Us


68 Circular Road, #02-01 049422, Singapore
Revenue Tower, Scbd, Jakarta 12190, Indonesia
4th Floor, Pinnacle Business Park, Andheri East, Mumbai, 400093
Cinnabar Hills, Embassy Golf Links Business Park, Bengaluru, Karnataka 560071
Connect With Us
68 Circular Road, #02-01 049422, Singapore
Revenue Tower, Scbd, Jakarta 12190, Indonesia
4th Floor, Pinnacle Business Park, Andheri East, Mumbai, 400093
Cinnabar Hills, Embassy Golf Links Business Park, Bengaluru, Karnataka 560071
Request Custom Transcript
Industrial PFAS Remediation: Thermal Oxidation vs Electrochemical Destruction Economics
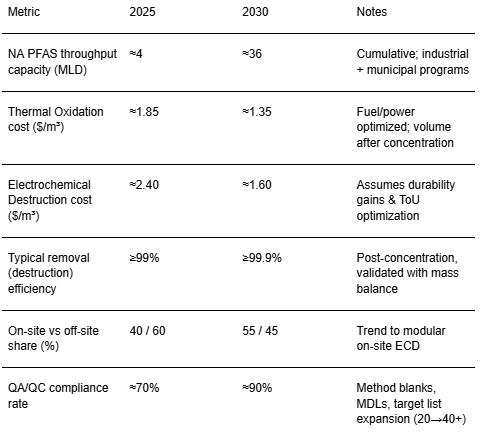
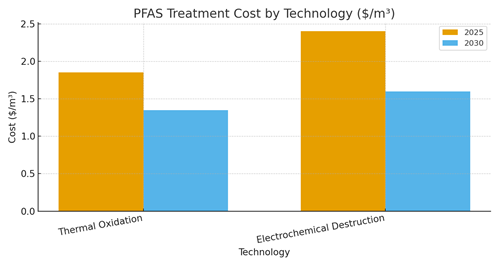
Per‑ and polyfluoroalkyl substances (PFAS) remediation in North America is transitioning from pilot to scaled programs across industrial wastewater, landfill leachate, AFFF-impacted sites, and drinking water residuals. From 2025–2030, two destruction pathways dominate techno‑economic discussions: high‑temperature thermal oxidation (TO)—including fluidized bed and rotary kiln variants—and electrochemical destruction (ECD) platforms (e.g., boron‑doped diamond, catalytic electrodes). Both are typically paired downstream of concentration steps (GAC/IX, foam fractionation, RO/FO) to reduce volume and increase destruction efficiency. Illustratively, cumulative North American throughput expands from ~4 MLD in 2025 to ~36 MLD by 2030 as state and federal standards tighten and consent decrees drive action. Normalized treatment costs trend downward with scale, operations learning, and power hedging: TO falls from about $1.85/m³ in 2025 to ~$1.35/m³ in 2030; ECD declines from ~$2.40/m³ to ~$1.60/m³. TO benefits from fuel flexibility, proven mineralization at temperature, and robust off‑gas controls; key OPEX drivers are auxiliary fuel and air handling. ECD’s economics hinge on kWh/kg‑PFAS removal, electrode durability, and co‑contaminant management; it enables on‑site, modular deployment with reduced air permitting exposure.
What's Covered?
Report Summary
Key Takeaways
1) PFAS programs scale from ~4 → ~36 MLD throughput in North America by 2030 (illustrative).
2) Thermal oxidation cost declines to ~$1.35/m³; electrochemical to ~$1.60/m³ with durability gains.
3) Concentration (GAC/IX, foam, RO) remains essential to lower destruction OPEX and increase efficacy.
4) ECD is favored for modular on‑site destruction; TO for centralized, high‑volume off‑site streams.
5) Energy is the key lever: ToU/PPAs improve ECD economics; waste‑heat/fuel integration boosts TO.
6) Air and HF management are critical for TO; electrode life and co‑contaminants for ECD.
7) QA/QC and mass balance verification differentiate credible destruction from mere transfer.
8) Procurement shifts to outcome guarantees: destruction %, by‑product limits, uptime, $/m³ caps.
Key Metrics
Market Size & Share
North America’s PFAS destruction market expands steadily through 2030 as regulatory clarity and funding drive implementation. Cumulative treatment throughput rises from ~4 MLD in 2025 to ~36 MLD by 2030 in this illustrative scenario. Municipal utilities account for early scale due to drinking water mandates, but industrial facilities grow share as consent decrees and product stewardship programs mature. Market share bifurcates along logistics: centralized off‑site destruction hubs favor thermal oxidation due to volume aggregation and fuel integration, while on‑site destruction at industrial campuses tilts toward electrochemical systems that avoid transport liabilities and air permitting complexity.
Vendor share consolidates around platforms that integrate capture + destruction with robust QA/QC and verifiable mass balance. Concentration remains the economic hinge—GAC/IX, foam fractionation, and RO reduce $/m³ dramatically by shrinking the destruction duty. By 2030, buyers standardize packages (e.g., 250–1,500 m³/day ECD skids; 10–50 t/day TO plants) to compress delivery timelines and de‑risk commissioning. Regional shares skew toward California, the Northeast, and Great Lakes for early adoption, with Texas and Ontario scaling rapidly on vendor presence and utility capacity.

Market Analysis
Normalized treatment costs decline across both destruction pathways by 2030. Thermal oxidation benefits from fuel integration, higher turndown ratios, and learning in off‑gas handling; costs fall from ~$1.85 to ~$1.35/m³. Electrochemical destruction experiences sharper reductions—from ~$2.40 to ~$1.60/m³—as electrode lifetimes extend, stack efficiency improves (kWh/kg‑PFAS removed), and utilities implement ToU tariffs or PPAs to manage power costs. Sensitivities are dominated by: (1) influent PFAS speciation and co‑contaminants (affecting energy and destruction kinetics), (2) degree of pre‑concentration, and (3) energy price hedging.
Risk factors differ. For TO: air permitting, HF scrubbing media, and auxiliary fuel supply; for ECD: electrode replacement intervals, fouling, and electrical capacity. Mitigations include standardized QA/QC (TOP assay, fluoride accounting), robust off‑gas trains (RTO+scrubbers), pre‑treatment to cut organics, and outcome‑based contracts that guarantee destruction %, by‑product thresholds, and $/m³ caps. Financing improves as programs shift from pilots to multi‑site frameworks with shared spares and O&M, enabling lower contingency and faster ramp‑up.
Trends & Insights (2025–2030)
• Capture + destroy standard: concentration trains paired with destruction to avoid waste transfer liabilities.
• On‑site modularity: containerized ECD skids reduce transport risk and permitting; micro‑grids/PPAs stabilize OPEX.
• Off‑site hubs: TO facilities co‑locate with waste‑to‑energy or industrial plants to leverage heat and utilities.
• QA/QC rigor: mass balance via TOP assay + fluoride accounting becomes baseline for acceptance testing.
• Safety and compliance: TO needs robust off‑gas/HF controls; ECD focuses on electrical safety and gas evolution.
• Broader target lists: expansion from legacy PFAS to short‑chain and precursors drives higher capture/destruction specs.
• Data & MRV: digitized chain‑of‑custody, on‑line sensors, and auditable MRV platforms become procurement requirements.
• Contracting shift: outcome‑based SLAs (destruction %, uptime) with penalties/bonuses replace pure T&M models.
Segment Analysis
• Industrial wastewater (chemicals, plating, semiconductors): high co‑contaminants favor robust pre‑treatment; on‑site ECD reduces hauling risks.
• Landfill leachate: volume variability and organics push toward centralized TO after foam fractionation/RO; some on‑site ECD at large sites.
• AFFF‑impacted remediation: batch destruction programs; TO for consolidated wastes, ECD for field‑deployable pilots.
• Drinking water residuals: GAC/IX regenerant or RO brines; stringent QA/QC and low residual targets; both TO and ECD viable depending on logistics.
Buyer guidance: select concentration to minimize $/m³; decide on on‑site vs off‑site based on logistics, permitting, and utility capacity; lock power/fuel costs; specify MRV and mass balance; and structure contracts with performance guarantees and clear by‑product limits.
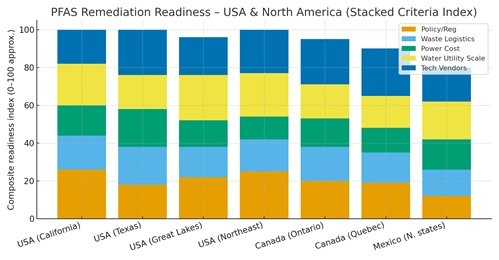
Geography Analysis (USA & North America)
PFAS destruction readiness is uneven but improving. California and the Northeast score high on policy/regulatory drivers and the scale of water utilities; the Great Lakes corridor benefits from dense treatment infrastructure; Texas combines strong vendor ecosystems with logistics for centralized off‑site destruction; Ontario and Quebec progress on provincial guidance and major utilities; northern Mexico advances where cross‑border logistics and vendor support exist. Stacked criteria (policy/regulation, waste logistics, power cost, water‑utility scale, vendor presence) illustrate composite readiness rather than any single determinant.
Implications: centralized TO hubs fit regions with strong waste logistics and vendor capacity (e.g., Texas, Ontario). On‑site ECD is attractive where power costs can be hedged (PPAs/ToU) and where transport liabilities are costly (California, Northeast). The Great Lakes sees mixed strategies given plant density. Cross‑border cooperation can lift Mexico’s scores through shared vendor networks and standardized QA/QC protocols.
Competitive Landscape (Ecosystem & Delivery Models)
Competition spans capture vendors (GAC/IX/foam/RO), destruction OEMs (TO reactors, ECD stacks), off‑gas and HF controls, and MRV platforms. Differentiation centers on energy intensity ($/m³), demonstrated mass balance, durability of electrodes/linings, and bankable warranties. Service models shift toward BOO/BOOT with outcome guarantees (destruction %, uptime, by‑product thresholds) and auditable MRV. Utilities and large industrials favor multi‑site frameworks with shared spares and mobile bridging capacity to handle outages. Leaders package end‑to‑end trains—capture + destruction + QA/QC—with standardized skids and commissioning playbooks. Partnerships between waste firms, independent power providers (for PPAs), and analytics vendors create defensible offerings. As procurement matures, vendor selection emphasizes verifiable destruction, safety record, and predictable $/m³ under realistic co‑contaminant loads.
Report Details
Proceed To Buy
Want a More Customized Experience?
- Request a Customized Transcript: Submit your own questions or specify changes. We’ll conduct a new call with the industry expert, covering both the original and your additional questions. You’ll receive an updated report for a small fee over the standard price.
- Request a Direct Call with the Expert: If you prefer a live conversation, we can facilitate a call between you and the expert. After the call, you’ll get the full recording, a verbatim transcript, and continued platform access to query the content and more.
68 Circular Road, #02-01 049422, Singapore
Revenue Tower, Scbd, Jakarta 12190, Indonesia
4th Floor, Pinnacle Business Park, Andheri East, Mumbai, 400093
Cinnabar Hills, Embassy Golf Links Business Park, Bengaluru, Karnataka 560071
Request Custom Transcript
Related Transcripts

$ 1445

$ 1345
$ 1432

68 Circular Road, #02-01 049422, Singapore
Revenue Tower, Scbd, No.52-53, Jakarta 12190, Indonesia
Cinnabar Hills, Embassy Golf Links Business Park, Bengaluru, Karnataka 560071
4th Floor, Pinnacle Business Park, Andheri East, Mumbai, 400093


68 Circular Road, #02-01 049422, Singapore
Revenue Tower, Scbd, Jakarta 12190, Indonesia
4th Floor, Pinnacle Business Park, Andheri East, Mumbai, 400093
Cinnabar Hills, Embassy Golf Links Business Park, Bengaluru, Karnataka 560071