

68 Circular Road, #02-01 049422, Singapore
Revenue Tower, Scbd, Jakarta 12190, Indonesia
4th Floor, Pinnacle Business Park, Andheri East, Mumbai, 400093
Cinnabar Hills, Embassy Golf Links Business Park, Bengaluru, Karnataka 560071


Connect With Us


68 Circular Road, #02-01 049422, Singapore
Revenue Tower, Scbd, Jakarta 12190, Indonesia
4th Floor, Pinnacle Business Park, Andheri East, Mumbai, 400093
Cinnabar Hills, Embassy Golf Links Business Park, Bengaluru, Karnataka 560071
Connect With Us
68 Circular Road, #02-01 049422, Singapore
Revenue Tower, Scbd, Jakarta 12190, Indonesia
4th Floor, Pinnacle Business Park, Andheri East, Mumbai, 400093
Cinnabar Hills, Embassy Golf Links Business Park, Bengaluru, Karnataka 560071
Request Custom Transcript
Industrial Decarbonization in the U.S.: Heat Electrification, Hydrogen Substitution & CCS Costs
From 2025 to 2030, U.S. industrial decarbonization will be defined by pragmatic deployment of three pathways: heat electrification (low- to medium‑temperature), targeted hydrogen substitution for high‑temperature and legacy combustion systems, and carbon capture and storage (CCS) on process and combustion streams. Together, these can deliver material emissions cuts while preserving energy security and product quality across chemicals, refining, food & beverage, paper, cement, and metals. Heat electrification scales fastest where process temperatures are ≤200 °C and waste‑heat recovery is available. High‑temperature industrial heat pumps and electric boilers shift thermal duty to the grid; competitiveness hinges on electricity‑to‑gas spreads (including carbon), time‑of‑use optimization, and process integration that minimizes temperature lift. Hydrogen substitution initially blue/transition hydrogen and increasingly green targets furnaces, kilns, and direct‑fired units where electrification is impractical. Its economics improve with falling electrolyzer capex, lower renewable power prices, and hub‑based supply from DOE‑backed hydrogen clusters. CCS plays a complementary role on calcination and combustion sources where capture is technically mature and storage access is strong (Gulf Coast, Great Plains). CO₂ transport networks and Class VI permitting speed are decisive.
What's Covered?
Report Summary
Key Takeaways
1) Electrify ≤200 °C heat first highest COP and fastest payback with waste‑heat integration.
2) Hydrogen targets high‑temperature, direct‑fired assets; hubs reduce delivered cost by 2030.
3) CCS best fits process‑intrinsic CO₂ and large point sources with nearby storage access.
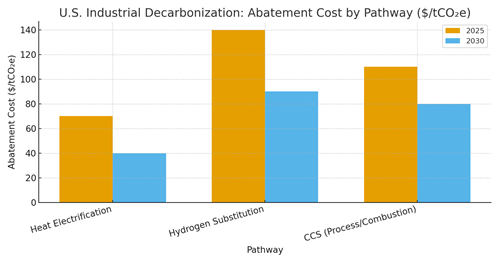
4) Abatement costs trend to ~$40 (electrify), ~$80–90 (CCS/H₂) per tCO₂e by 2030 (illustrative).
5) DOE hubs, 45Q credits, and utility tariffs (ToU) materially shift project economics.
6) Grid carbon intensity matters cleaner regions yield higher tCO₂ abatement per MWh.
7) Portfolio PPAs and hedges de‑risk OPEX vs spot power and hydrogen price volatility.
8) Outcome‑based SLAs (COP, capture rate, uptime) improve finance ability and delivery.
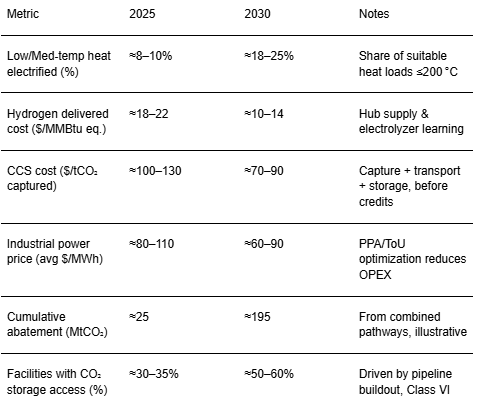
Key Metrics
Market Size & Share
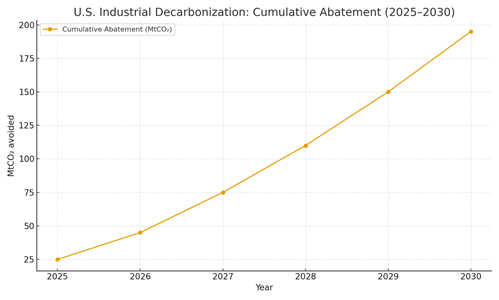
U.S. industry’s decarbonization build‑out accelerates through 2030, led by electrification of low/medium‑temperature heat, followed by selective hydrogen substitution and CCS on hard‑to‑abate sources. In this illustrative outlook, cumulative abatement rises from ~25 MtCO₂ in 2025 to ~195 MtCO₂ by 2030 as facilities sequence quick wins: heat pumps and electric boilers where ≤200 °C service dominates, then fuel switching and CCS where process constraints apply. Share dynamics favor electrification in food, beverage, paper, chemicals, and district steam preheat, while hydrogen and CCS gain share in cement, refining, metals, and petrochemicals with large point sources and intrinsic CO₂ streams. Market share concentration emerges around integrated providers bundling hardware, controls, and outcome‑based service. Regional shares skew toward Gulf Coast clusters (heavy industry and storage geology), California/Pacific Northwest (clean grids for high‑quality abatement), and Midwest manufacturing corridors with pipeline rights‑of‑way. As projects move from one‑off pilots to portfolios, buyers standardize modules and balance‑of‑plant designs to compress timelines.
Market Analysis
Abatement costs converge downward by 2030. Heat electrification benefits from COP gains, standardized skids, and tariff optimization (~$70 → ~$40/tCO₂e). Hydrogen substitution rides electrolyzer learning, hub logistics, and renewable PPAs (~$140 → ~$90/tCO₂e). CCS improves with solvent/adsorbent upgrades and utilization of shared transport/storage (~$110 → ~$80/tCO₂e). Comparative economics depend on site conditions: grid carbon intensity, waste‑heat availability, duty factor, and proximity to storage. Sensitivity work typically shows a 10 K reduction in temperature lift can raise COP ~4–6%, and co‑recovering 20–40 °C waste‑heat can lower levelized heat cost by $3–6/MWhth. Financing improves via outcome‑based contracts (heat availability, capture rate, hydrogen uptime) and federal incentives (e.g., 45Q). Key bottlenecks include MV interconnection, CO₂ pipeline siting, and workforce skills (H₂ handling, CCS O&M). Mitigations: early grid studies, anchor‑shipper CO₂ capacity bookings, and safety‑forward commissioning plans (HAZOP/LOPA).
Trends & Insights (2025–2030)
• Electrify first: high‑temp heat pumps/e‑boilers for ≤200 °C services; hybrid with existing boilers for peaks.
• Hydrogen hubs: delivered costs fall with shared pipelines, large offtake, and low‑cost renewables; interim blue H₂ bridges gaps.
• CCS networks: common‑carrier CO₂ lines in Gulf Coast/Great Plains unlock capture at scale and process‑intrinsic sources.
• Digital optimization: model‑predictive control and ToU dispatch lift COP and reduce power OPEX; performance guarantees gain traction.
• Contracts & credits: 45Q, direct pay options, and state incentives improve IRR; PPAs hedge power price risks.
• Safety emphasis: H₂ (leak detection, ventilation) and CCS solvents (amine management) require robust HAZOP/LOPA.
• Workforce & supply chain: compressor OEM capacity, transformer lead times, and EPC bandwidth drive schedules.
• Measurement & verification: MRV platforms to track abatement, uptime, and pathway‑level performance for ESG reporting.
Segment Analysis
• Food/Beverage & Paper: dominant near‑term electrification via heat pumps (120–180 °C) and electric boilers; strong waste‑heat synergies.
• Chemicals & Refining: hydrogen pilots for fired heaters/hydrotreaters; CCS on hydrogen SMRs and FCC units in clusters with storage access.
• Cement & Metals: process‑intrinsic CO₂ favors CCS; hydrogen/e‑fuels for high‑temp kilns/furnaces where feasible; electrified preheat to shrink duty.
• District Steam & Campuses: e‑boilers/HT‑HPs preheat returns, paired with thermal storage for ToU arbitrage. Procurement tips: prioritize heat‑mapping/pinch analysis; stage projects (electrify base‑load, CCS/process next, H₂ for peaks); specify KPIs (COP@point, capture %, uptime); and consolidate multi‑site buys to unlock volume pricing and spares logistics.
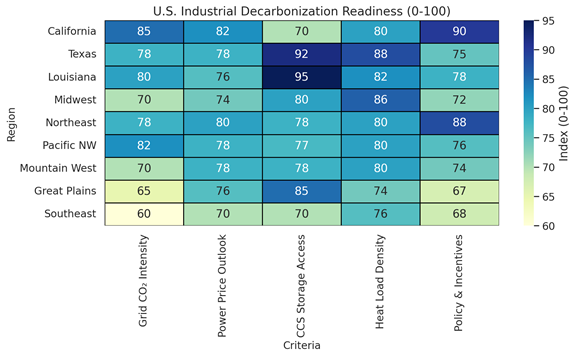
Geography Analysis (United States)
Regional readiness diverges. Gulf Coast (TX/LA) leads for CCS and hydrogen due to storage geology, pipeline ROWs, and heat‑load density. California and the Pacific Northwest deliver high‑quality abatement from electrification thanks to cleaner grids and policy support. The Midwest combines large manufacturing bases with prospective storage and existing pipeline corridors, while the Northeast leans on policy incentives and demand‑side programs. Southeast progress is shaped by power price trajectories and industrial mix. Site‑selection priorities: clean grid MWh for electrified heat, proximity to hydrogen hubs and CO₂ transport, and permitting cadence for MV interconnection or Class VI wells. Bundling projects within clusters improves economics via shared infrastructure and labor pools.
Competitive Landscape (Ecosystem & Delivery Models)
Ecosystem players span electrification OEMs/integrators (heat pumps, e‑boilers, controls), hydrogen producers and hub developers, and CCS capture/transport/storage providers. Differentiation centers on high‑lift efficiency, delivered hydrogen cost, capture rate and energy penalty, and the strength of MRV and service models. Utilities and midstream firms increasingly offer turnkey power‑to‑heat tariffs, hydrogen offtake, or CO₂ take‑away contracts. As portfolios scale, performance‑linked service agreements and green‑finance instruments (linked to verified abatement) gain share. Winners provide bankable, outcome‑based offerings with clear safety and compliance frameworks.
Report Details
Proceed To Buy
Want a More Customized Experience?
- Request a Customized Transcript: Submit your own questions or specify changes. We’ll conduct a new call with the industry expert, covering both the original and your additional questions. You’ll receive an updated report for a small fee over the standard price.
- Request a Direct Call with the Expert: If you prefer a live conversation, we can facilitate a call between you and the expert. After the call, you’ll get the full recording, a verbatim transcript, and continued platform access to query the content and more.
68 Circular Road, #02-01 049422, Singapore
Revenue Tower, Scbd, Jakarta 12190, Indonesia
4th Floor, Pinnacle Business Park, Andheri East, Mumbai, 400093
Cinnabar Hills, Embassy Golf Links Business Park, Bengaluru, Karnataka 560071
Request Custom Transcript
Related Transcripts

68 Circular Road, #02-01 049422, Singapore
Revenue Tower, Scbd, No.52-53, Jakarta 12190, Indonesia
Cinnabar Hills, Embassy Golf Links Business Park, Bengaluru, Karnataka 560071
4th Floor, Pinnacle Business Park, Andheri East, Mumbai, 400093


68 Circular Road, #02-01 049422, Singapore
Revenue Tower, Scbd, Jakarta 12190, Indonesia
4th Floor, Pinnacle Business Park, Andheri East, Mumbai, 400093
Cinnabar Hills, Embassy Golf Links Business Park, Bengaluru, Karnataka 560071