

68 Circular Road, #02-01 049422, Singapore
Revenue Tower, Scbd, Jakarta 12190, Indonesia
4th Floor, Pinnacle Business Park, Andheri East, Mumbai, 400093
Cinnabar Hills, Embassy Golf Links Business Park, Bengaluru, Karnataka 560071


Connect With Us


68 Circular Road, #02-01 049422, Singapore
Revenue Tower, Scbd, Jakarta 12190, Indonesia
4th Floor, Pinnacle Business Park, Andheri East, Mumbai, 400093
Cinnabar Hills, Embassy Golf Links Business Park, Bengaluru, Karnataka 560071
Connect With Us
68 Circular Road, #02-01 049422, Singapore
Revenue Tower, Scbd, Jakarta 12190, Indonesia
4th Floor, Pinnacle Business Park, Andheri East, Mumbai, 400093
Cinnabar Hills, Embassy Golf Links Business Park, Bengaluru, Karnataka 560071
Request Custom Transcript
Financial Super-Apps in the West: User Growth, Cross-Sell Rates & Revenue per Active User (2025–2030)
Financial super-apps in the West are rapidly evolving, driven by increasing user adoption, enhanced cross-selling capabilities, and improved revenue per active user (ARPU). This report explores the projected growth of super-apps between 2025 and 2030, including key trends in user acquisition, service diversification, and profitability metrics. With a focus on the U.S. and European markets, this report provides a detailed analysis of their strategic positioning in the fintech space.

What's Covered?
Report Summary

What is the projected user growth rate for financial super-apps in the West between 2025 and 2030?
Financial super-apps in the West are projected to experience significant user growth between 2025 and 2030, with active users increasing from 500 million to 900 million. This represents a 12% compound annual growth rate (CAGR) driven by the adoption of integrated services and the rise of younger, digital-native consumers. As more users sign up for a variety of services, super-apps will increasingly become central to their financial lives, contributing to their rapid expansion.

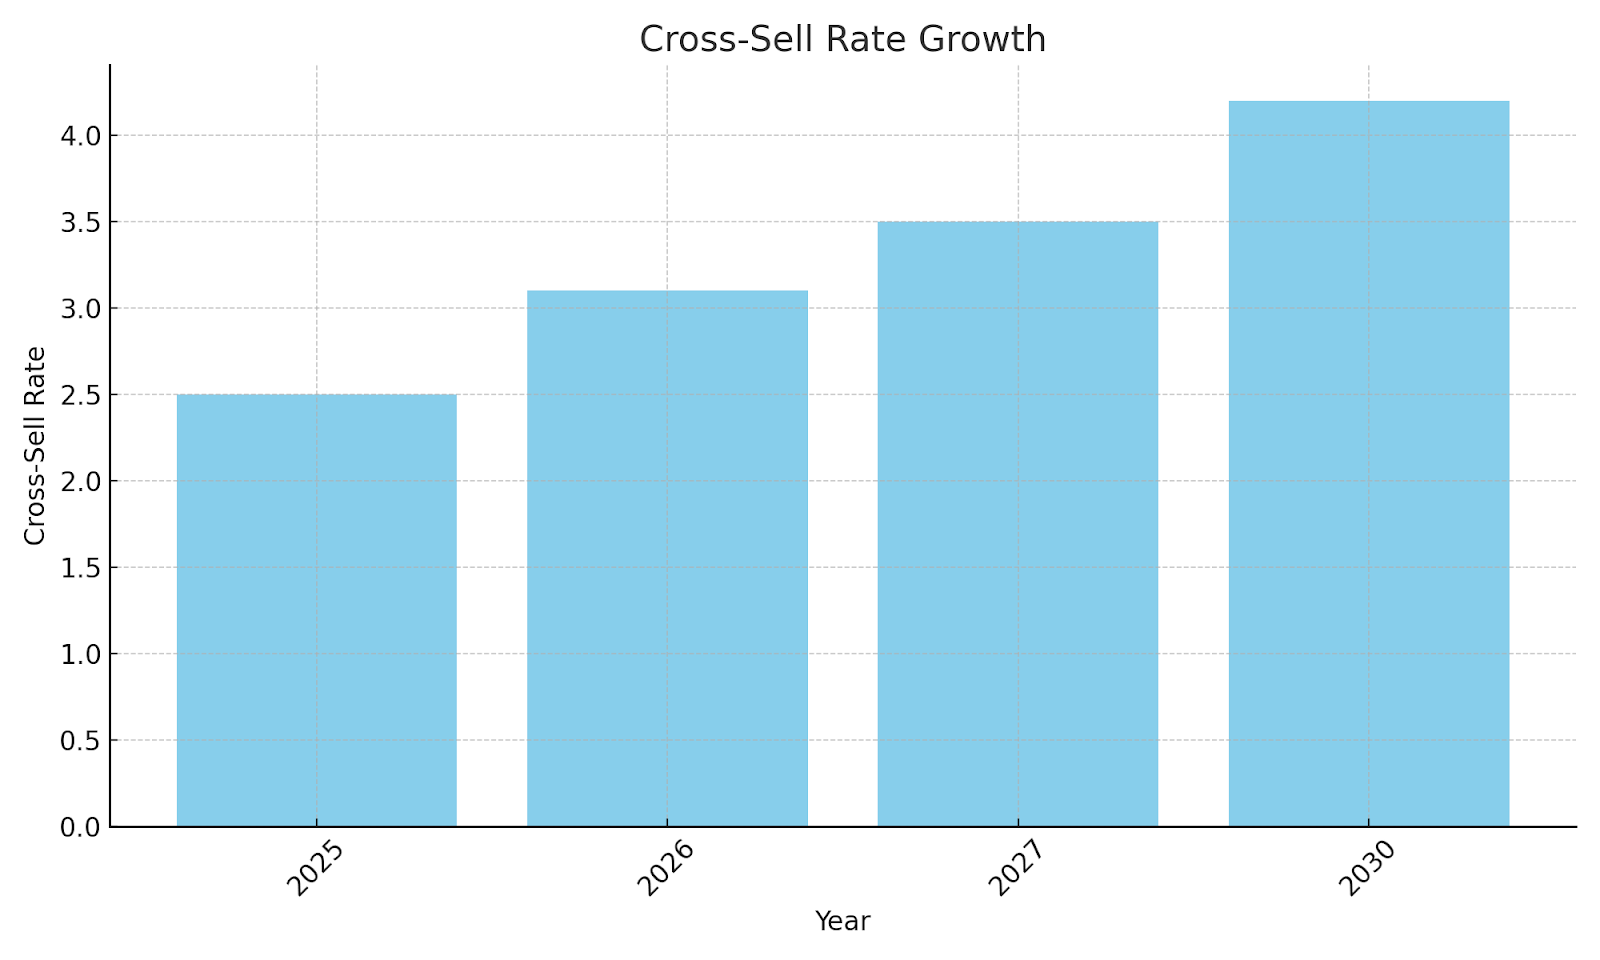
How will cross-sell rates evolve as financial super-apps expand their service offerings?
Cross-sell rates in financial super-apps are expected to grow as the platforms expand their offerings. Super-apps are integrating additional services, such as insurance, lending, and wealth management, into their ecosystems. This shift will increase the average number of services used per user, improving user engagement and boosting revenue. By 2030, the cross-sell rate is expected to rise from 2.5 to 4.2, driven by more personalized offerings and seamless user experiences.
What are the primary revenue drivers for super-apps, and how will ARPU change by 2030?
The primary revenue drivers for financial super-apps include transaction fees, subscription models, embedded finance, and cross-selling additional financial products. As the ecosystem grows and diversifies, average revenue per user (ARPU) is expected to increase by 35%, from $45 in 2025 to $61 by 2030. The growth in ARPU will be largely attributed to higher user engagement and the adoption of new, high-margin services.
How does the regulatory landscape impact the development and scalability of super-apps in the West?
The regulatory landscape for super-apps is evolving in the West, with increased scrutiny on data privacy, financial services compliance, and user protection. While regulatory clarity helps establish trust, it also adds challenges in scaling services. The imposition of stricter rules may slow down innovation but is expected to bring long-term benefits as super-apps become more integrated into the financial system. Companies must adapt to new frameworks, especially for cross-border payments and lending.

What are the most important services being cross-sold to super-app users, and how do they affect loyalty?
Super-apps are increasingly cross-selling services like loans, insurance, savings accounts, and investment products to enhance customer loyalty and engagement. By offering a comprehensive suite of services, users become more entrenched in the ecosystem, increasing lifetime value (LTV). These offerings also help super-apps achieve higher cross-sell rates, which is projected to increase to 4.2 by 2030. The more services a user adopts, the less likely they are to leave, fostering higher retention rates.
What are the key risks and challenges for financial super-apps in maintaining user growth and profitability?
As the market for super-apps becomes more competitive, the main risks include regulatory hurdles, customer acquisition costs, and the challenge of scaling new services while maintaining high-quality user experiences. Additionally, privacy concerns and cybersecurity threats could hinder growth. Super-apps must balance rapid expansion with sustainable profitability, especially as they enter saturated markets with established players.
How do financial super-apps compare to traditional banks in terms of user engagement and product adoption?
Super-apps are outpacing traditional banks in terms of user engagement, as they provide seamless, integrated financial services that appeal to digitally-savvy consumers. Users of super-apps tend to interact with the app more frequently, using multiple services like payments, loans, savings, and investments. In comparison, traditional banks are still catching up in terms of product offerings, digital infrastructure, and user engagement, with many focusing on digitizing existing products
.
What role does embedded finance play in super-apps' revenue growth?
Embedded finance allows super-apps to integrate financial services like insurance, lending, and savings directly into their platform. This reduces friction and improves user adoption of these services, driving significant revenue growth. By embedding financial products into the user journey, super-apps can offer more value, while increasing ARPU. Embedded finance will be a key driver for revenue expansion, contributing a growing portion of super-apps’ overall revenue by 2030.
What are the main risks and challenges for super-apps in their expansion from 2025 to 2030?
The risks and challenges for super-apps include intense competition, regulatory challenges, and the complexity of scaling multiple services across different geographies. Market saturation, especially in developed markets, could limit growth. Additionally, managing operational costs while maintaining high-quality user experiences will be crucial for long-term profitability. Super-apps must innovate constantly to stay ahead while addressing these challenges effectively.
How do financial super-apps expand their reach to underserved populations, and what does this mean for the market?
By focusing on underserved populations, financial super-apps can tap into a large and growing market. Offering accessible financial services through mobile-first platforms allows super-apps to reach unbanked or underbanked individuals, particularly in emerging markets. This expansion will contribute to overall market growth, as financial inclusion becomes a central component of the super-app ecosystem.

Key Takeaways
• Rapid User Growth: Financial super-apps in the West are projected to see 12% CAGR in active users between 2025 and 2030.
• Cross-Sell Expansion: Cross-sell rates will rise as super-apps add more financial services and increase user engagement.
• Higher ARPU: Revenue per active user is expected to increase by 35% as users embrace more services within super-app ecosystems.
• Increased Market Share: Top players (e.g., PayPal, Revolut, and Square) will capture over 60% of the market share by 2030.
• Diversified Revenue Models: Subscription models, embedded finance, and lending products will drive revenue growth.
Report Details
Proceed To Buy
Want a More Customized Experience?
- Request a Customized Transcript: Submit your own questions or specify changes. We’ll conduct a new call with the industry expert, covering both the original and your additional questions. You’ll receive an updated report for a small fee over the standard price.
- Request a Direct Call with the Expert: If you prefer a live conversation, we can facilitate a call between you and the expert. After the call, you’ll get the full recording, a verbatim transcript, and continued platform access to query the content and more.
68 Circular Road, #02-01 049422, Singapore
Revenue Tower, Scbd, Jakarta 12190, Indonesia
4th Floor, Pinnacle Business Park, Andheri East, Mumbai, 400093
Cinnabar Hills, Embassy Golf Links Business Park, Bengaluru, Karnataka 560071
Request Custom Transcript
Related Transcripts


68 Circular Road, #02-01 049422, Singapore
Revenue Tower, Scbd, No.52-53, Jakarta 12190, Indonesia
Cinnabar Hills, Embassy Golf Links Business Park, Bengaluru, Karnataka 560071
4th Floor, Pinnacle Business Park, Andheri East, Mumbai, 400093


68 Circular Road, #02-01 049422, Singapore
Revenue Tower, Scbd, Jakarta 12190, Indonesia
4th Floor, Pinnacle Business Park, Andheri East, Mumbai, 400093
Cinnabar Hills, Embassy Golf Links Business Park, Bengaluru, Karnataka 560071