

68 Circular Road, #02-01 049422, Singapore
Revenue Tower, Scbd, Jakarta 12190, Indonesia
4th Floor, Pinnacle Business Park, Andheri East, Mumbai, 400093
Cinnabar Hills, Embassy Golf Links Business Park, Bengaluru, Karnataka 560071


Connect With Us


68 Circular Road, #02-01 049422, Singapore
Revenue Tower, Scbd, Jakarta 12190, Indonesia
4th Floor, Pinnacle Business Park, Andheri East, Mumbai, 400093
Cinnabar Hills, Embassy Golf Links Business Park, Bengaluru, Karnataka 560071
Connect With Us
68 Circular Road, #02-01 049422, Singapore
Revenue Tower, Scbd, Jakarta 12190, Indonesia
4th Floor, Pinnacle Business Park, Andheri East, Mumbai, 400093
Cinnabar Hills, Embassy Golf Links Business Park, Bengaluru, Karnataka 560071
Request Custom Transcript
EV Charging Infrastructure in Europe: Grid Integration, Utilization Rates & RoI Metrics (2025–2030)
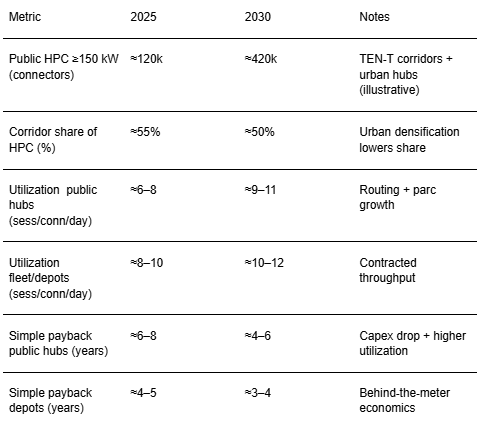
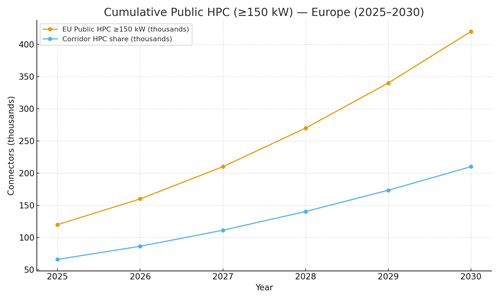
From 2025 to 2030, Europe’s EV charging build‑out shifts from coverage to performance: interconnection speed, tariff optimization, and utilization discipline become the profit levers. High‑power DC (≥150 kW) expands along TEN‑T corridors and urban hubs, while fleets/depot DC absorb daytime energy behind the meter. The center of gravity for returns is predictable demand attached to retail, logistics, and municipal depots. Our illustrative outlook shows public high‑power connectors rising from ~120k in 2025 to ~420k by 2030, with corridor sites remaining ~50% of stock as urban hubs densify. Utilization lifts from ~6–8 to ~9–11 sessions/connector/day as vehicle parc grows and routing software smooths peaks. RoI improves as capex/connector falls with standardized 400–500 kW cabinets, power‑sharing, and factory‑built skids. Payback periods compress from ~6–8 years in 2025 toward ~4–6 years by 2030 for well‑sited public hubs, and ~4–5 to ~3–4 years for fleet/depots with contracted throughput. The gating factor is grid: medium‑voltage connections, switchgear lead times, and civil works.
What's Covered?
Report Summary
Key Takeaways
1) Grid interconnection speed and tariff structures now decide site NPV more than hardware pricing.
2) Power‑sharing cabinets and modular skids cut capex/connector and speed commissioning.
3) Utilization discipline (routing, dwell management) is the strongest RoI lever post‑coverage.
4) Contracted fleet throughput derisks cash flows; public hubs need retail anchors and tenure.
5) Demand‑charge mitigation (TOU, peak‑shaving batteries) protects margins at high‑kW sites.
6) Uptime SLAs and preventive maintenance sustain revenue; spare‑parts logistics matter.
7) AFIR targets + national grants shape pipelines; concession quality drives bankability.
8) Telemetry transparency wins financing and concessions; publish utilization and uptime KPIs.
Key Metrics
Market Size & Share
Europe’s fast‑charging footprint scales along two vectors: TEN‑T corridors and urban nodes tied to retail and logistics. In this illustrative view, public high‑power connectors (≥150 kW) grow from ~120k in 2025 to ~420k by 2030. Corridor sites hold ~50–55% share as countries meet AFIR coverage, while urban hubs densify to serve commuter and ride‑hail loads. The fleet/depot DC segment expands behind the meter with contracted daytime energy, but public HPC remains the principal visibility and reliability benchmark for drivers.
Share concentrates with operators that control interconnect timelines, publish transparent utilization/uptime KPIs, and standardize power‑sharing cabinets and factory‑built skids. Country shares reflect demand density (vehicle parc, highway flows), policy, and grid readiness. Northern and Western Europe maintain leadership given early adoption and concessions maturity; Southern and Central/Eastern Europe accelerate from 2027 as interconnect pipelines and incentives deepen. By 2030, the market is characterized by a few pan‑European operators alongside strong national players with dense urban portfolios and fleet partnerships.
Market Analysis
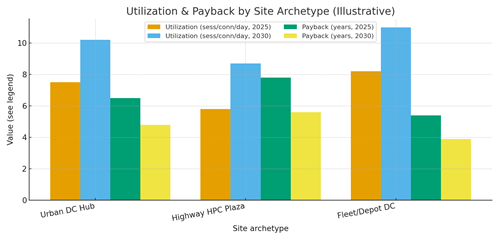
RoI is a function of utilization, capex/connector, energy margin, and demand‑charge exposure. In this outlook, utilization for public hubs rises from ~6–8 to ~9–11 sessions/connector/day by 2030; fleet/depots lift from ~8–10 to ~10–12 with contracted throughput. Payback compresses from ~6–8 to ~4–6 years for public hubs and ~4–5 to ~3–4 years for depots as standardized 400–500 kW cabinets, power‑sharing, and pre‑fabricated skids lower capex and speed commissioning. Highway plazas catch up on utilization as parc grows and routing software prioritizes HPC availability; urban hubs sustain superior economics via co‑located retail.
Risk drivers include interconnect delays, transformer/switchgear lead times, peak pricing volatility, and hardware downtime. Mitigations: early DSO/TSO engagement, TOU/demand response, battery peak‑shaving, and rigorous preventive maintenance with spare‑parts SLAs. Winner playbooks combine fleet contracts (baseline energy), retail anchors (dwell), and transparent telemetry to unlock project finance at scale.
Trends & Insights (2025–2030)
• Grid first: interconnect playbooks, pre‑approved designs, and joint trenching schedules compress timelines.
• Capex standardization: factory skids, shared rectifiers, and liquid‑cooled cables reduce $/connector.
• Demand‑charge strategy: TOU contracts, battery peak‑shaving, and managed charging stabilize margins.
• Telemetry transparency: publish uptime/utilization; lenders and concessions now require it.
• Routing intelligence: APIs with automakers/apps steer demand to available high‑uptime sites.
• Depot partnerships: contracted throughput hedges public volatility and improves bankability.
• O&M maturity: predictive maintenance, hot‑swap modules, and parts depots cut MTTR.
• Concession quality: longer tenure, clear KPI regimes, and indexation underpin financing terms.
Segment Analysis
• Urban DC hubs: 6–12 stalls, 150–400 kW, retail anchors; highest utilization; capex per connector benefits from power‑sharing.
• Highway HPC plazas: 8–24+ stalls, 300–500 kW; utilization grows with parc; corridor concessions are strategic.
• Fleet/depots: 150–350 kW; contracted MWh/day; behind‑the‑meter tariffs and batteries improve economics.
• Destination/parking: mixed power; useful for redundancy; weaker standalone RoI without anchors.
Buyer guidance: prioritize grid‑ready sites; right‑size stalls/cabinets to realistic dwell; secure fleet baseload; and structure uptime/utilization KPIs into concessions and finance.
Geography Analysis (Europe)
Readiness is highest in Germany, the Netherlands, Nordics, France, and the UK, where EV parc, grid capacity, and policy align. Spain and Italy accelerate with new tenders and grid upgrades; Poland and broader CEE scale with corridor funding and manufacturing investments. The stacked criteriagrid interconnect, incentives/policy, demand density, tariff friendliness, and supply/service indicate where balanced ecosystems support bankable charging portfolios and where targeted interventions are needed.
Implications: stage corridor build first where concessions and grid timelines are shortest; densify urban hubs with retail anchors; and deploy depot DC in logistics zones to lock contracted throughput.

Competitive Landscape (Operators, OEMs & EPCs)
Competition spans pan‑EU charge‑point operators, national champions, fleet‑focused EPCs, and energy retailers. Differentiators: interconnect speed, utilization ramp, tariff control, and uptime. Leaders bundle energy supply, routing partnerships, and telemetry dashboards for lenders and hosts. Financing structures evolve toward project finance with contracted fleet baseloads and concession KPIs (uptime, utilization per stall). Hardware ecosystems consolidate around modular, liquid‑cooled cabinets and standardized service parts. Delivery models: public hubs with retail anchors; corridor concessions with availability SLAs; and fleet depots with energy‑as‑a‑service. Players that execute grid strategy, O&M discipline, and transparent KPIs will capture Europe’s EV charging growth through 2030.
Report Details
Proceed To Buy
Want a More Customized Experience?
- Request a Customized Transcript: Submit your own questions or specify changes. We’ll conduct a new call with the industry expert, covering both the original and your additional questions. You’ll receive an updated report for a small fee over the standard price.
- Request a Direct Call with the Expert: If you prefer a live conversation, we can facilitate a call between you and the expert. After the call, you’ll get the full recording, a verbatim transcript, and continued platform access to query the content and more.
68 Circular Road, #02-01 049422, Singapore
Revenue Tower, Scbd, Jakarta 12190, Indonesia
4th Floor, Pinnacle Business Park, Andheri East, Mumbai, 400093
Cinnabar Hills, Embassy Golf Links Business Park, Bengaluru, Karnataka 560071
Request Custom Transcript
Related Transcripts


68 Circular Road, #02-01 049422, Singapore
Revenue Tower, Scbd, No.52-53, Jakarta 12190, Indonesia
Cinnabar Hills, Embassy Golf Links Business Park, Bengaluru, Karnataka 560071
4th Floor, Pinnacle Business Park, Andheri East, Mumbai, 400093


68 Circular Road, #02-01 049422, Singapore
Revenue Tower, Scbd, Jakarta 12190, Indonesia
4th Floor, Pinnacle Business Park, Andheri East, Mumbai, 400093
Cinnabar Hills, Embassy Golf Links Business Park, Bengaluru, Karnataka 560071