

68 Circular Road, #02-01 049422, Singapore
Revenue Tower, Scbd, Jakarta 12190, Indonesia
4th Floor, Pinnacle Business Park, Andheri East, Mumbai, 400093
Cinnabar Hills, Embassy Golf Links Business Park, Bengaluru, Karnataka 560071


Connect With Us


68 Circular Road, #02-01 049422, Singapore
Revenue Tower, Scbd, Jakarta 12190, Indonesia
4th Floor, Pinnacle Business Park, Andheri East, Mumbai, 400093
Cinnabar Hills, Embassy Golf Links Business Park, Bengaluru, Karnataka 560071
Connect With Us
68 Circular Road, #02-01 049422, Singapore
Revenue Tower, Scbd, Jakarta 12190, Indonesia
4th Floor, Pinnacle Business Park, Andheri East, Mumbai, 400093
Cinnabar Hills, Embassy Golf Links Business Park, Bengaluru, Karnataka 560071
Request Custom Transcript
EV Battery Recycling: Closed-Loop Systems & Lithium Recovery Economics
Between 2025 and 2030, the UK and Europe will scale EV battery recycling from pilot lines to industrial networks that close the loop on lithium, nickel, and cobalt while meeting producer-responsibility rules. Capacity additions track rising end-of-life packs, manufacturing scrap from gigafactories, and import flows. Regulatory drivers EU Battery Regulation and UK stewardship schemes push higher collection targets, recycled-content mandates, and traceable MRV, anchoring bankable offtake for recovered materials. Unit economics hinge on feedstock mix (NMC/NCA vs LFP), metal prices, recovery yields, and process design. Hydromet routes dominate for highest lithium recovery and product purity; pyromet offers robustness for mixed feeds and safety but historically sacrificed lithium unless paired with hydromet polishing. Emerging direct-recycling and sulfate-to-precursor pathways promise energy savings and cathode-grade outputs. Illustrative values show lithium’s relative contribution rising toward 2030 with LFP volumes and lithium demand, while nickel/cobalt contributions normalize. Operators that deliver high lithium recovery (>85–90%) with low reagent intensity and energy optimization will widen margins.
What's Covered?
Report Summary
Key Takeaways
1) Lithium recovery is the margin swing factor as LFP share rises target >85–90% Li recovery at battery-grade purity.
2) Flexible flowsheets (pyro + hydro, or hydro-only) hedge feedstock variability and safety constraints.
3) Closed-loop contracts (OEM–cell–recycler) secure feedstock and index offtake to metal benchmarks.
4) Digital passports + MRV reduce claims risk and support recycled-content premiums.
5) Modular preprocessing near hubs lowers hazardous logistics and improves yields.
6) Second-life screening diverts healthy modules to stationary storage before recycling.
7) Energy, reagent intensity, and waste minimization define competitive cost curves.
8) Safety-by-design (discharge, fire mitigation, robotics) is essential for bankability.
Key Metrics

Market Size & Share
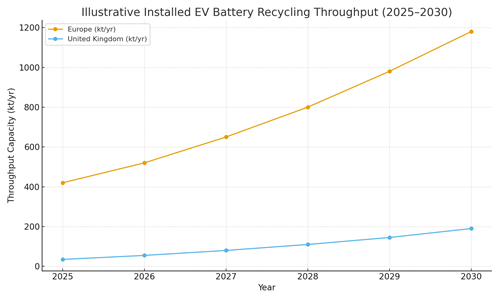
Europe’s EV battery recycling market is transitioning from distributed pilots to integrated networks. Our illustrative installed throughput rises from ~420 kt/yr in 2025 to ~1,180 kt/yr by 2030, with the UK scaling from ~35 to ~190 kt/yr. Early share concentrates in Germany and the Netherlands due to policy clarity, dense EV stock, and port/logistics advantages; the UK’s share grows with domestic gigafactory scrap and strengthened stewardship schemes. Feedstock supply expands from manufacturing scrap (near-term) to end-of-life packs (post-2027), shifting chemistry mix toward LFP alongside NMC/NCA.
Share evolution depends on (1) OEM contracts and collection performance, (2) siting relative to ports, OEMs, and black-mass corridors, (3) readiness of permitting and safety frameworks, and (4) access to low-carbon power and water/waste treatment. Operators combining modular preprocessing with centralized hydromet refineries can capture corridor-based share across UK & EU trade lanes.
Market Analysis
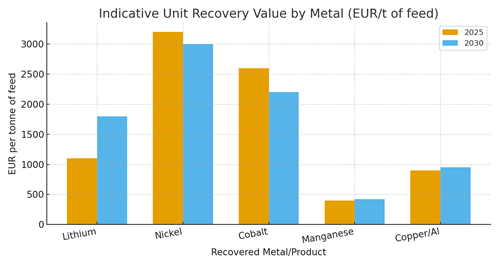
Unit value per tonne of feed is driven by contained metals and recovery efficiency. Our illustrative values show lithium’s contribution rising toward 2030 as LFP volumes grow and lithium demand tightens, while nickel/cobalt normalize with supply expansions and chemistry shifts. Yield and reagent efficiency are the primary margin levers in hydromet circuits; energy integration and by-product recovery (graphite, Cu/Al) add incremental value. Direct recycling and precursor routes can capture cathode-grade value where feedstock is homogeneous and traceable.
Cost stack considerations: energy and reagents dominate OPEX; waste treatment and permitting add fixed overhead; logistics can swing costs depending on hazardous transport constraints. Contracts that index offtake to benchmark prices (with quality adjustments) and include energy/reagent pass-through clauses reduce earnings volatility. Facilities with low-carbon electricity can market lower embedded emissions, improving offtake pricing.
Trends & Insights
Closed-loop contracting expands: OEM–cell–recycler alliances with take-back, processing, and indexed offtake terms. Direct recycling gains traction for homogenous NMC streams; hydromet remains the workhorse for mixed feeds and lithium recovery. Digital passports & MRV mature, enabling recycled-content claims and scope-3 accounting. Safety automation scales: robotic dismantling, smart discharge, fire detection, and inert-atmosphere shredding. Second-life screening standardizes with state-of-health analytics and warranty frameworks. Green premiums emerge for low-embedded-emission precursors and battery-grade lithium products.
Segment Analysis
OEMs & Cell Makers: prioritize closed-loop partnerships, yield guarantees, and traceable outputs. Pre-processors & Logistics: focus on safe, modular hubs near ports and OEM clusters; value-add via sorting and deactivation. Hydromet/Pyromet Operators: differentiate on Li recovery, reagent/energy intensity, and waste minimization. Energy & Utilities: provide low-carbon power and heat integration; offer tariff structures for electro-intensive loads. Second-life Integrators: monetize screened modules; coordinate with recyclers for end-of-second-life flows.
Geography Analysis
Readiness is strongest in Germany and the Netherlands, followed by the UK and the Nordics. Germany combines high EV density, policy clarity, and industrial capability; the Netherlands offers port logistics and trader networks; the UK leverages stewardship programs and growing gigafactory activity. Spain, Italy, and Poland accelerate through EU funding and industrial corridors. Site selection should weigh permitting lead times, logistics corridors, and low‑carbon energy access to support premium, low‑CI outputs.

Competitive Landscape
The ecosystem spans OEMs, cell manufacturers, pre-processors, hydromet/pyromet operators, chemical companies, logistics specialists, and marketplaces. Winners offer flexible flowsheets with high Li/Ni/Co yields, robust safety systems, and bankable MRV; they secure corridor‑based feedstock and sell battery‑grade outputs under indexed contracts. Expect consolidation and JV structures that bundle collection, preprocessing, refining, and offtake to reduce counterparty risk and accelerate scale across UK and EU hubs.
Report Details
Proceed To Buy
Want a More Customized Experience?
- Request a Customized Transcript: Submit your own questions or specify changes. We’ll conduct a new call with the industry expert, covering both the original and your additional questions. You’ll receive an updated report for a small fee over the standard price.
- Request a Direct Call with the Expert: If you prefer a live conversation, we can facilitate a call between you and the expert. After the call, you’ll get the full recording, a verbatim transcript, and continued platform access to query the content and more.
68 Circular Road, #02-01 049422, Singapore
Revenue Tower, Scbd, Jakarta 12190, Indonesia
4th Floor, Pinnacle Business Park, Andheri East, Mumbai, 400093
Cinnabar Hills, Embassy Golf Links Business Park, Bengaluru, Karnataka 560071
Request Custom Transcript
Related Transcripts
$ 1445

$ 1345
$ 1432

68 Circular Road, #02-01 049422, Singapore
Revenue Tower, Scbd, No.52-53, Jakarta 12190, Indonesia
Cinnabar Hills, Embassy Golf Links Business Park, Bengaluru, Karnataka 560071
4th Floor, Pinnacle Business Park, Andheri East, Mumbai, 400093


68 Circular Road, #02-01 049422, Singapore
Revenue Tower, Scbd, Jakarta 12190, Indonesia
4th Floor, Pinnacle Business Park, Andheri East, Mumbai, 400093
Cinnabar Hills, Embassy Golf Links Business Park, Bengaluru, Karnataka 560071