Get in touch with us to learn more about our services, ask for assistance with a technical difficulty, or if you would like a product demo.
info@nextyn.com
Singapore
68 Circular Road, #02-01
049422, Singapore
Jakarta

Revenue Tower, Scbd, Jakarta 12190, Indonesia
Mumbai
4th Floor, Pinnacle Business Park, Andheri East, Mumbai, 400093
Bangalore

Cinnabar Hills, Embassy Golf Links Business Park, Bengaluru, Karnataka 560071
Twitter IconInstagram FaviconLinkedin Icon

Connect With Us

Thank you for submitting the form
Oops! Something went wrong while submitting the form.
Industry:
Energy, Sustainability & Environment

EV Battery Price Collapse to $115/kWh: Margin Optimization, Supply Chain Winners & Future Cost Curves (2025–2030)

Global EV battery pack prices are projected to fall from $139/kWh in 2024 to $115/kWh by 2030, driven by cathode innovation, localized cell production, and recycling efficiencies. This decline reshapes OEM margins, reorders supplier hierarchies, and redefines the global cost curve. The report explores how automakers, suppliers, and material providers optimize margins and adapt to a maturing EV cost landscape across the U.S., EU, and Asia

A graphic showing Transcript IQ topical report
Category: 
Advanced
Insight Code: 
67T8R
Format: 
PDF / PPT / Excel
Deliverables: Primary Research Report + Infographic Pack

What's Covered?

What is the projected global battery price curve through 2030?
How will cost declines affect OEM gross margins and EV pricing?
Which battery chemistries will dominate cost competitiveness?
What are the primary drivers of cost reduction across the value chain?
How do recycling and second-life applications influence price stability?
Who are the key supply chain winners among materials and component providers?
How do regional cost differences (China vs. U.S. vs. EU) evolve through 2030?
What margin optimization levers are OEMs deploying?
What risks could slow or reverse the cost decline trend?
What does the 2025–2030 roadmap for next-gen battery technologies look like?

Report Summary

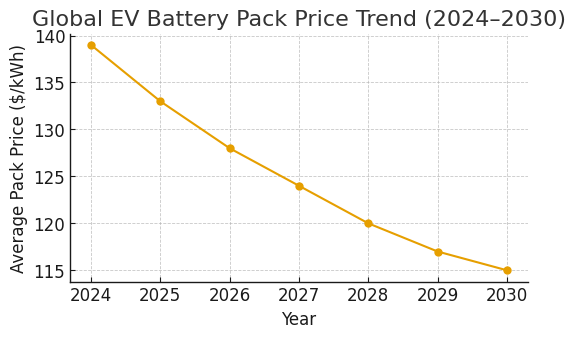
1. Global Battery Price Curve (2024–2030)

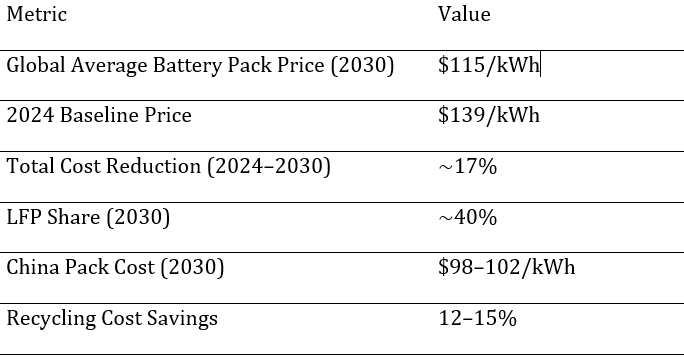
Average global battery pack prices are projected to drop from $139/kWh in 2024 to $115/kWh by 2030, reflecting economies of scale, raw material efficiency, and cathode innovation. China maintains a structural advantage due to vertical integration and lower energy costs.

2. OEM Margin Impact & Pricing Strategies

A 17% reduction in pack prices boosts OEM margins by 3–5% per vehicle, assuming partial cost pass-through. Automakers like Tesla, BYD, and Hyundai are using lower pack costs to improve affordability while sustaining profitability.

3. Dominant Battery Chemistries

LFP batteries gain significant market share due to lower costs and safety advantages, expected to reach ~40% by 2030. NMC maintains use in premium models, while solid-state R&D remains a long-term play with commercialization post-2030.

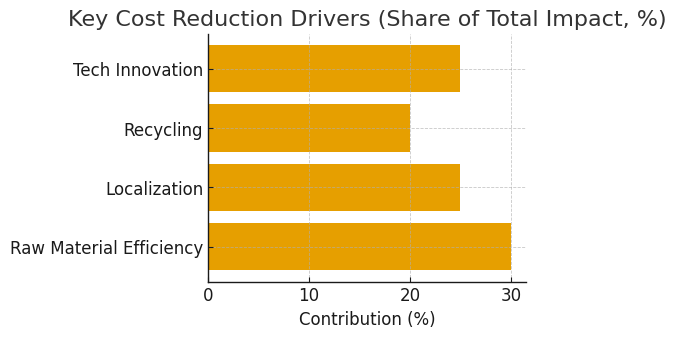
4. Cost Reduction Drivers Across Value Chain

Three key levers — raw material optimization, localization, and recycling — account for over 80% of total cost savings. Localized production in the U.S. and Europe reduces logistics and tariff costs by up to $10/kWh.

5. Recycling & Second-Life Applications

Battery recycling contributes up to 15% cost reduction through recovery of lithium, nickel, and cobalt. Companies like Redwood Materials and CATL’s recycling divisions are scaling closed-loop systems that reduce raw material dependency.

6. Supply Chain Winners

Suppliers leading in cathode production (CATL, LG Energy Solution) and LFP chemistry (BYD, Gotion High-Tech) benefit the most. Anode and separator innovations from SK On and Panasonic strengthen their position in high-energy density segments.

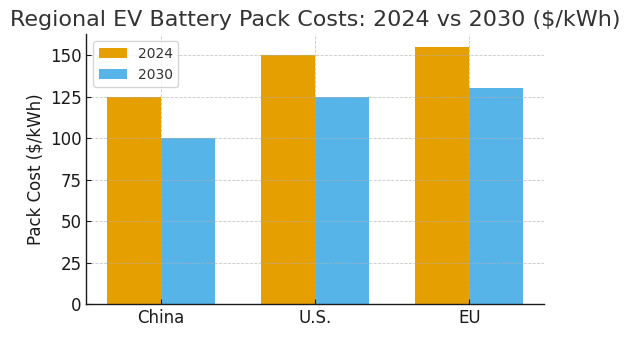
7. Regional Cost Comparison (2024–2030)

Regional disparities persist with China maintaining sub-$100/kWh packs, while U.S. and EU stabilize around $125–130/kWh due to energy and labor costs.

8. OEM Margin Optimization Levers

OEMs are leveraging in-house cell manufacturing, pack standardization, and supply contracts with miners to stabilize costs. Tesla’s 4680 cells and BYD’s blade batteries exemplify scale-driven cost efficiency.

9. Risks to Cost Decline

Key risks include raw material volatility (nickel, lithium), regulatory delays, and underinvestment in recycling infrastructure. If lithium prices spike above $35,000/ton again, cost parity could be delayed by two years.

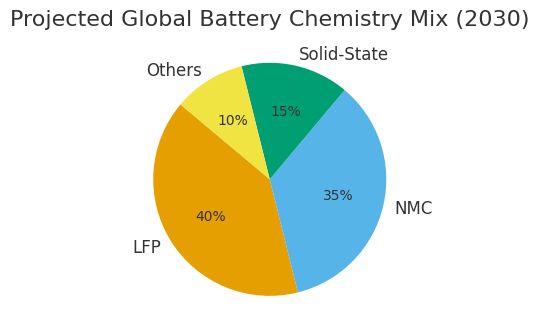
10. Battery Chemistry Market Share (2030)

By 2030, LFP chemistry will command 40% of the global market, followed by NMC at 35%, solid-state at 15%, and others (LMFP, Sodium-ion) at 10%. This diversification improves supply resilience and cost predictability.

Key Takeaways

• Battery pack prices to fall ~17% from $139/kWh (2024) to $115/kWh (2030).

• LFP chemistry to reach ~40% market share by 2030, displacing NMC dominance.

• China sustains cost leadership with sub-$100/kWh packs by 2030.

• Recycling and second-life recovery to cut raw material costs by 12–15%.

• Localized cell production in U.S. and EU narrows cost gap by $10–15/kWh.

• Solid-state tech remains 5–7 years from commercialization but influences future curves.

Report Details

Last Updated: September 2025
Base Year: 2024
Estimated Years: 2025 - 2030

Proceed To Buy

Thank you! Your submission has been received!
Oops! Something went wrong while submitting the form.
Download Free PDF

Want a More Customized Experience?

  • Request a Customized Transcript: Submit your own questions or specify changes. We’ll conduct a new call with the industry expert, covering both the original and your additional questions. You’ll receive an updated report for a small fee over the standard price.
  • Request a Direct Call with the Expert: If you prefer a live conversation, we can facilitate a call between you and the expert. After the call, you’ll get the full recording, a verbatim transcript, and continued platform access to query the content and more.

Get in touch with us to learn more about our services, ask for assistance with a technical difficulty, or if you would like a product demo.
info@nextyn.com
Singapore
68 Circular Road, #02-01
049422, Singapore
Jakarta

Revenue Tower, Scbd, Jakarta 12190, Indonesia
Mumbai
4th Floor, Pinnacle Business Park, Andheri East, Mumbai, 400093
Bangalore

Cinnabar Hills, Embassy Golf Links Business Park, Bengaluru, Karnataka 560071
Twitter IconInstagram FaviconLinkedin Icon

Request Custom Transcript

Thank you for submitting the form
Oops! Something went wrong while submitting the form.

Related Transcripts

$ 1350

November 2025

Post-Combustion Carbon Capture, Utilization, and Storage (CCUS) Systems: Solvent-Based Systems & Power Plant Retrofits

Between 2025 and 2030, North American post‑combustion CCUS moves from demonstration to scaled deployment on coal and natural‑gas power plants, cement, and industrial boilers. The economic engine is solvent‑based capture paired with reliable transport and Class VI storage or EOR‑to‑storage transitions. Technology leadership consolidates around advanced amines (e.g., piperazine/AMP blends) and water‑lean/non‑aqueous solvents that cut reboiler duty while sustaining high capture rates and manageable degradation. Retrofit designs standardize: compact absorbers, high‑performance structured packing, lean‑rich heat integration, advanced reclaiming, and corrosion‑resistant metallurgy. Digital twins and plant‑wide optimization reduce parasitic load and ramping penalties. Illustratively, cumulative capture capacity addressed by post‑combustion retrofits in North America could grow from ~13 to ~80 MtCO₂/yr by 2030, with the USA rising from ~10 to ~60 MtCO₂/yr. Energy penalty trends decline from ~3.6 GJ/t (MEA) toward ~2.2–2.5 GJ/t for advanced systems by 2030, with capture efficiencies of ~94–97% at design. Bankability rests on stacked incentives (e.g., tax credits), robust storage permitting, and balance‑of‑plant integration that preserves net output and water management. Risk shifts from core capture performance to integration: steam extraction, ductwork tie‑ins, grid services under capture operation, and solvent management/MRV.

Carbon Capture
USA
North America

$ 1395

November 2025

LNG Storage Storage Infrastructure and Terminal Engineering: 9% Nickel Steel Adoption & Floating Regasification Units

From 2025 to 2030, North American LNG infrastructure pivots on two engineering vectors: the continued dominance of 9% nickel steel in onshore full‑containment tanks and the strategic use of floating storage and regasification units (FSRUs) to add rapid, modular capacity. 9% Ni steel remains the reference material for cryogenic service due to toughness at −196 °C, weldability, and long service life; learning curves, shop prefabrication, and automated welding drive incremental cost and schedule gains through 2030. In parallel, FSRUs compress time‑to‑market by leveraging converted LNG carriers or newbuilds, shifting capex to opex via charter models and enabling seasonal or transitional capacity. Illustratively, cumulative onshore storage additions rise from ~0.6 to ~2.9 million m³ between 2025 and 2030, while FSRU regas capacity scales from ~0.6 to ~4.0 bcf/d. Material selection remains a cost‑and‑schedule decision: 9% Ni steel benchmarks at an index of 100 in 2025 for both cost and lead time; alternatives such as 304L stainless and aluminum alloys carry higher indices today, with moderate convergence by 2030 as supply chains deepen. Risk management focuses on cold box metallurgy, weld QA/QC, and foundation/settlement control for full‑containment tanks; for FSRUs, interface risks dominate (mooring, cryogenic transfer arms, send‑out pressure control) along with marine permitting and hurricane resilience.

Oil & Gas Storage & Transportation
USA
North America

$ 1395

November 2025

Environmental Consulting and Sustainability Management Frameworks: ESG Compliance & Supply Chain Decarbonization Strategies

From 2025 to 2030, North American organizations will navigate a step-change in sustainability management as disclosure requirements expand, supplier expectations tighten, and capital markets reward credible transition plans. The consulting and services market unites three engines of demand: (1) ESG compliance and disclosure across multiple frameworks; (2) supply‑chain decarbonization with granular product and site‑level data; and (3) data platforms and MRV automation that convert sustainability workflows into auditable, repeatable processes. Enterprises are moving beyond one‑off reports toward integrated operating systems that connect finance, procurement, operations, and IT. The winners will operationalize governance, embed decarbonization into sourcing and capex, and instrument supply chains with verifiable data flows. Compliance sets the floor. Public companies confront rising expectations for greenhouse‑gas accounting, climate risk, and sustainability governance; private firms feel pull-through from customers, lenders, and insurers. Meanwhile, supply‑chain decarbonization becomes the cost‑effective frontier: category‑level roadmaps, supplier segmentation, and performance‑based contracts reduce emissions per unit cost. Service providers that pair strategy with execution target setting, data architecture, vendor enablement, and financing unlock durable value.

Environmental Consulting
USA
North America

$ 1450

November 2025
Get in touch with us to learn more about our services, ask for assistance with a technical difficulty, or if you would like a product demo.
info@nextyn.com
Singapore
68 Circular Road, #02-01
049422, Singapore
Jakarta

Revenue Tower, Scbd, Jakarta 12190, Indonesia
Mumbai
4th Floor, Pinnacle Business Park, Andheri East, Mumbai, 400093
Bangalore

Cinnabar Hills, Embassy Golf Links Business Park, Bengaluru, Karnataka 560071
Twitter IconInstagram FaviconLinkedin Icon

Buy Now

Thank you for submitting the form
Oops! Something went wrong while submitting the form.