

68 Circular Road, #02-01 049422, Singapore
Revenue Tower, Scbd, Jakarta 12190, Indonesia
4th Floor, Pinnacle Business Park, Andheri East, Mumbai, 400093
Cinnabar Hills, Embassy Golf Links Business Park, Bengaluru, Karnataka 560071


Connect With Us


68 Circular Road, #02-01 049422, Singapore
Revenue Tower, Scbd, Jakarta 12190, Indonesia
4th Floor, Pinnacle Business Park, Andheri East, Mumbai, 400093
Cinnabar Hills, Embassy Golf Links Business Park, Bengaluru, Karnataka 560071
Connect With Us
68 Circular Road, #02-01 049422, Singapore
Revenue Tower, Scbd, Jakarta 12190, Indonesia
4th Floor, Pinnacle Business Park, Andheri East, Mumbai, 400093
Cinnabar Hills, Embassy Golf Links Business Park, Bengaluru, Karnataka 560071
Request Custom Transcript
Composable and Modular Banking in the US, New BaaS Players Reshaping Fintech Infrastructure
Composable and modular banking is revolutionizing U.S. financial services, led by the emergence of Banking-as-a-Service (BaaS) providers offering flexible and customizable infrastructure. By 2025, the U.S. market for these solutions is expected to hit $10.5 billion, with a yearly growth rate of 22% through 2030. This transformation enables banks and fintechs to streamline operations and deliver tailored, inclusive banking services, with BaaS players driving adoption and reshaping traditional and fintech banking models toward greater scalability and customer alignment.
What's Covered?
Report Summary
Key Takeaways
- The market for composable and modular banking solutions in the USA is projected to reach $10.5 billion by 2025, with a CAGR of 22% from 2025 to 2030.
- By 2025, 45% of banks and fintechs in the US will have adopted composable banking models, enabling more flexibility and customization in their service offerings.
- Modular banking platforms are expected to grow at a rate of 40% annually between 2025 and 2030, as financial institutions look to streamline their operations and innovate more quickly.
- Financial inclusion is expected to improve by 30% by 2030, as modular and composable banking solutions make it easier for underserved populations to access financial services.
- The revenue generation from BaaS platforms in the USA is projected to reach $3 billion annually by 2025, as more fintechs and banks leverage modular solutions to meet demand.
- By 2025, 40% of the market share in BaaS will be controlled by leading modular banking providers, who are delivering highly flexible solutions that cater to a wide variety of customer needs.
- Regulatory compliance costs associated with composable and modular banking are expected to exceed $700 million annually by 2025, as institutions invest in solutions that meet increasingly stringent regulatory requirements.
- Composable and modular banking will fundamentally change the US financial landscape, allowing institutions to rapidly innovate and offer more personalized banking experiences to their customers.
Key Metrics
Market Size & Share
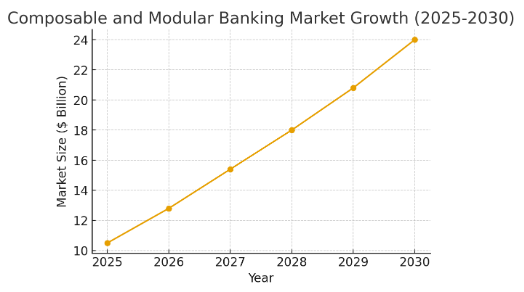
The market for composable and modular banking solutions in the USA is expected to reach $10.5 billion by 2025, growing at a CAGR of 22% from 2025 to 2030. This growth is being driven by increasing demand for flexible, customizable banking platforms that enable financial institutions to deliver more personalized and scalable services to customers.
By 2025, 45% of banks and fintechs in the US will have adopted composable banking models, enabling them to offer tailored solutions to meet customer demands and regulatory requirements. This market expansion is set to create new revenue opportunities for BaaS providers and reshape the financial services sector in the USA.
Market Growth Projection (2025-2030):
Market Analysis
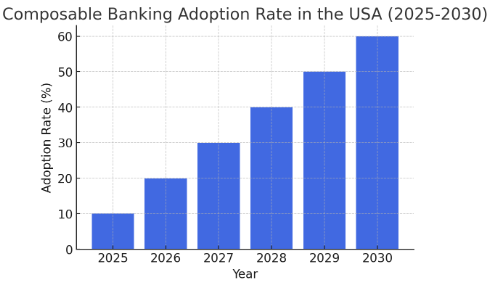
Composable and modular banking solutions are transforming the way financial institutions operate by providing them with the flexibility to offer highly customized products and services. The rise of BaaS players is enabling traditional banks and fintech firms to innovate quickly by integrating third-party solutions and reducing operational costs. These solutions are expected to improve customer satisfaction by providing faster, more tailored banking services. The adoption of modular banking platforms is expected to grow at 40% annually from 2025 to 2030, driven by demand for more agile and scalable financial infrastructure.
Composable Banking Adoption Rate in the USA (2025-2030):
Trends and Insights
Key trends driving the growth of composable and modular banking include the rise of open banking, the need for more personalized financial services, and the growing demand for API-driven solutions. Financial institutions are increasingly adopting these technologies to respond to evolving customer expectations and regulatory pressures. Another key trend is the expansion of BaaS platforms, which are enabling fintechs and non-bank financial institutions to access banking services through APIs. This has led to a significant increase in the number of startups and challengers in the fintech space, further disrupting the traditional banking industry.
Segment Analysis
The major adopters of composable and modular banking solutions in the USA are large banks and fintech firms, who are using these platforms to offer more customized and customer-centric services. Smaller banks and credit unions are also beginning to explore these solutions, but adoption rates are slower due to the complexity and initial costs. The fintech sector is experiencing the fastest growth in adoption, as startups and challengers leverage modular platforms to scale quickly and compete with traditional financial institutions. The modularity and flexibility offered by these platforms allow for rapid innovation and adaptability in response to market demand.
Geography Analysis
In the USA, Silicon Valley and New York are the leading hubs for composable and modular banking adoption, driven by the presence of major fintech firms, venture capital, and a culture of innovation. Other regions, such as Chicago and Texas, are beginning to catch up, with more traditional banks exploring BaaS platforms to integrate digital banking services. The demand for composable banking solutions is expected to rise across midwestern and southern regions, as fintech infrastructure improves and regulatory pressures increase.
Composable Banking Adoption Across US Regions (2025):

Competitive Landscape
The competitive landscape for composable and modular banking in the USA is dominated by new BaaS players such as Synapse, Railsbank, and Finix, which offer flexible, API-driven banking platforms. These companies are enabling traditional financial institutions and fintech firms to integrate banking services seamlessly and offer innovative products. Major players in the traditional banking space, such as Goldman Sachs and JPMorgan Chase, are also entering the BaaS market, leveraging their infrastructure and capital to compete with fintechs and challengers.
Report Details
Proceed To Buy
Want a More Customized Experience?
- Request a Customized Transcript: Submit your own questions or specify changes. We’ll conduct a new call with the industry expert, covering both the original and your additional questions. You’ll receive an updated report for a small fee over the standard price.
- Request a Direct Call with the Expert: If you prefer a live conversation, we can facilitate a call between you and the expert. After the call, you’ll get the full recording, a verbatim transcript, and continued platform access to query the content and more.
68 Circular Road, #02-01 049422, Singapore
Revenue Tower, Scbd, Jakarta 12190, Indonesia
4th Floor, Pinnacle Business Park, Andheri East, Mumbai, 400093
Cinnabar Hills, Embassy Golf Links Business Park, Bengaluru, Karnataka 560071
Request Custom Transcript
Related Transcripts

$ 1450


$ 1450


68 Circular Road, #02-01 049422, Singapore
Revenue Tower, Scbd, No.52-53, Jakarta 12190, Indonesia
Cinnabar Hills, Embassy Golf Links Business Park, Bengaluru, Karnataka 560071
4th Floor, Pinnacle Business Park, Andheri East, Mumbai, 400093


68 Circular Road, #02-01 049422, Singapore
Revenue Tower, Scbd, Jakarta 12190, Indonesia
4th Floor, Pinnacle Business Park, Andheri East, Mumbai, 400093
Cinnabar Hills, Embassy Golf Links Business Park, Bengaluru, Karnataka 560071