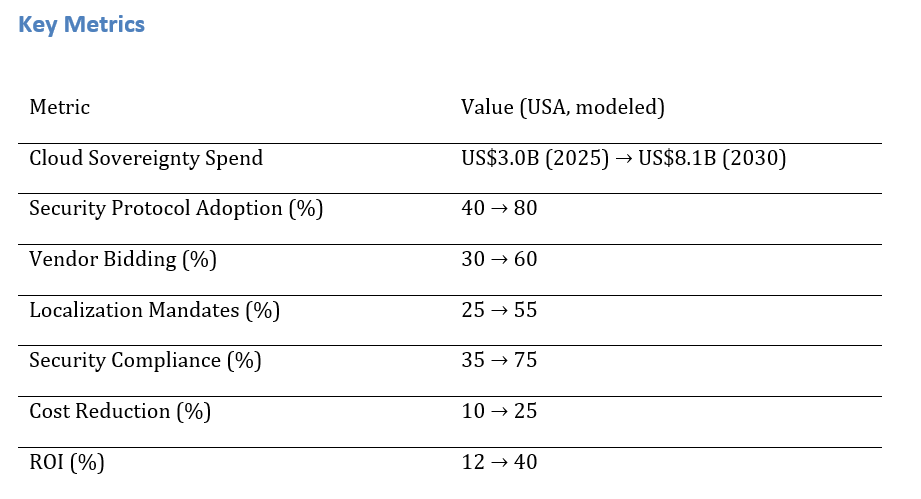
Cloud sovereignty in the U.S. public sector is expanding rapidly as governments strengthen security, compliance, and data localization. Spending is projected to grow from ~$3.0B in 2025 to ~$8.1B by 2030, driven by federal, state, and local adoption of secure, compliant cloud systems. Security protocol adoption will rise from 40% to 80%, while competitive vendor participation grows from 30% to 60%. Localization and SLA compliance will increase from 25% to 55%. The result is stronger data protection, reduced risk, and improved regulatory alignment. With clear SLAs and multi-cloud integration, cloud sovereignty will enhance efficiency and safeguard sensitive government data.
1. Cloud sovereignty spend grows from ~US$3.0B to ~US$8.1B by 2030.
2. Security protocol adoption increases from ~40% to ~80%, enhancing data protection.
3. Vendor bidding rates rise from ~30% to ~60%, fostering more competitive procurement processes.
4. Localization mandates will become the norm, growing from ~25% to ~55%.
5. Compliance automation tools streamline government data management by 2030.
6. TCO reduction improves by ~25% as cloud-native platforms replace legacy systems.
7. Vendor lock-in risks are mitigated by multi-cloud strategies.
8. ROI from cloud sovereignty initiatives rises from ~12% to ~40% by 2030.

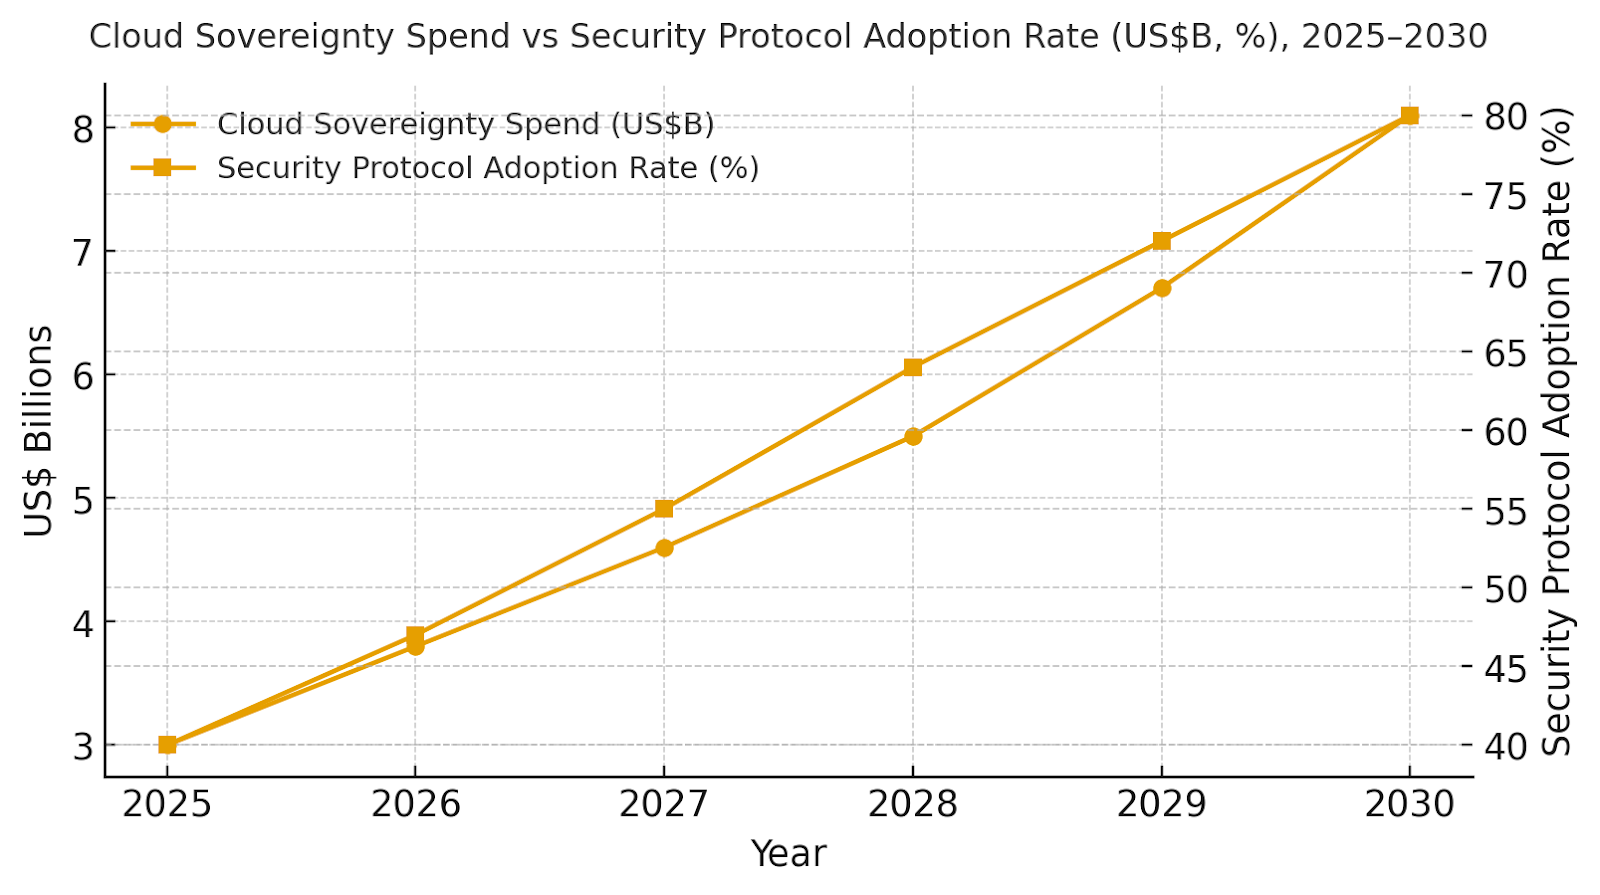
Cloud sovereignty spend in the U.S. public sector is expected to grow from ~US$3.0B in 2025 to ~US$8.1B by 2030. The dual‑axis figure shows spend rising while security protocol adoption increases from ~40% in 2025 to ~80% by 2030. Share consolidates around cloud-native vendors offering comprehensive compliance features, multi-cloud services, and flexible data residency solutions. Risks include vendor fragmentation, compliance delays, and security vulnerabilities; mitigations include robust SLAs, standardized APIs, and multi-cloud strategies.

Our model shows security protocol adoption growing from ~40% to ~80% by 2030, while cloud sovereignty spend rises from ~US$3.0B to ~US$8.1B. Vendor bidding will increase as multi-cloud options and advanced compliance solutions enter the market. Localization mandates will impact cloud strategies, and ROI is expected to increase from ~12% to ~40%. The bar figure summarizes shifts in KPIs: cost savings, security, and vendor retention.

1) Cloud-native infrastructure is being prioritized by the U.S. public sector for data security and regulatory compliance. 2) Multi-cloud architectures are gaining traction to reduce vendor lock-in. 3) Open APIs and hybrid solutions allow flexible cloud configurations. 4) Increased demand for compliance automation tools to meet local and global regulations. 5) Data residency requirements are accelerating the adoption of local cloud service providers. 6) AI-driven analytics are improving compliance monitoring and reporting capabilities. 7) Cross-border data flow regulations will continue to evolve as data privacy laws change.
Government agencies, defense, healthcare, and education sectors are leading cloud sovereignty initiatives. Defense agencies require highly secure, multi-cloud systems with strong compliance features. Healthcare and education sectors focus on data privacy and regulatory compliance, while public safety organizations prioritize uptime and operational continuity.
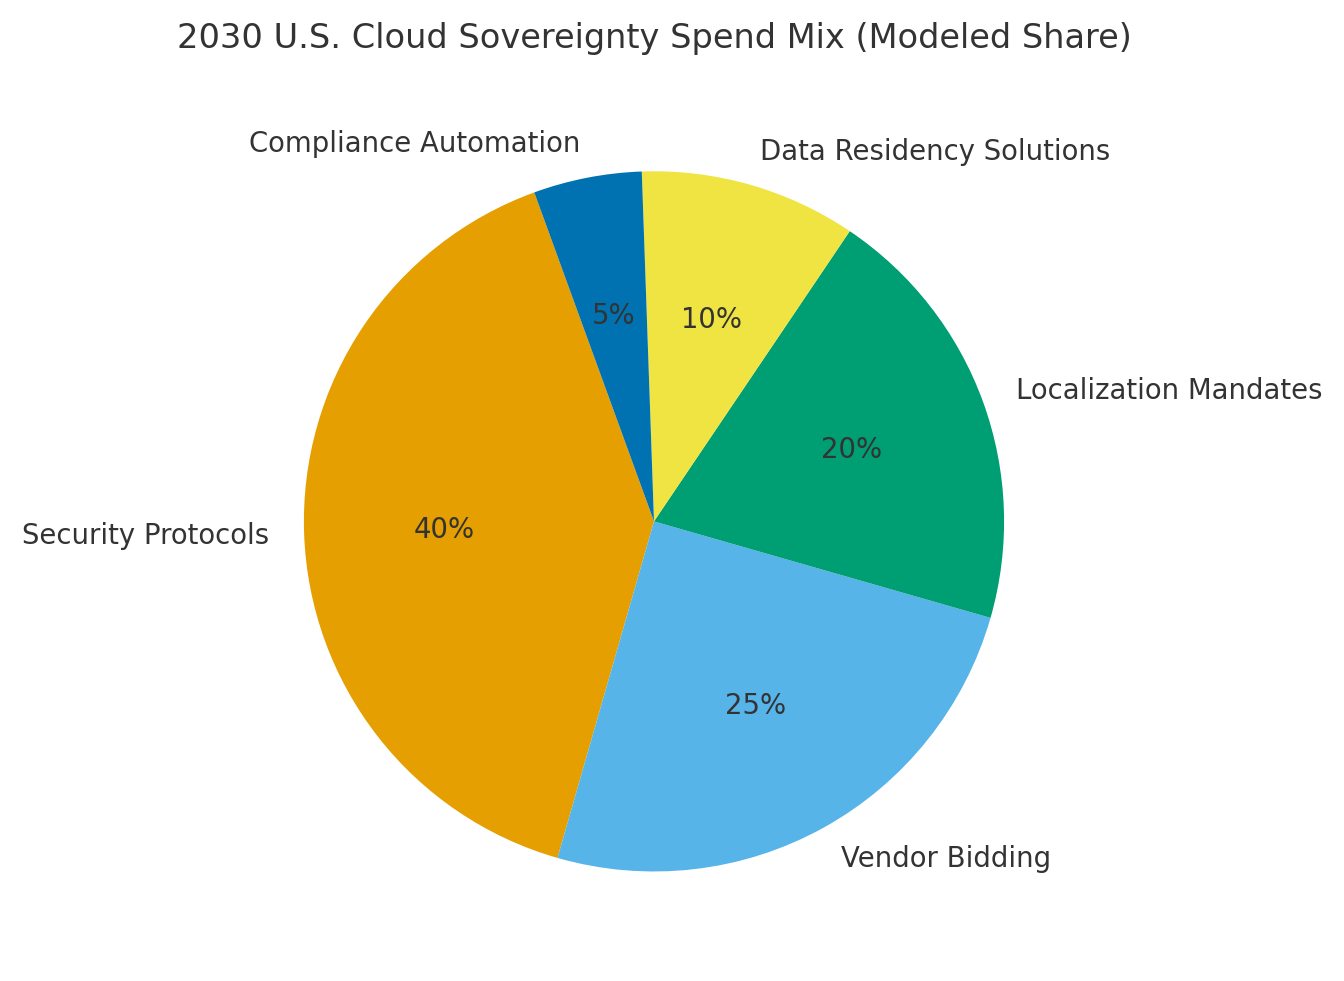
By 2030, U.S. cloud sovereignty spend mix will be: Security Protocols (~40%), Vendor Bidding (~25%), Localization Mandates (~20%), Data Residency Solutions (~10%), and Compliance Automation (~5%). Execution will focus on multi-cloud strategies, cloud security frameworks, and data compliance. Adoption is expected to be concentrated in federal agencies, with strong adoption across state and local governments.

Cloud service providers (AWS, Microsoft Azure, Google Cloud) lead in offering cloud sovereignty solutions for the U.S. public sector. Differentiation factors include (1) multi-cloud capabilities, (2) security-focused APIs, (3) compliance automation tools, (4) flexible SLAs, and (5) cost-effective pricing models. Procurement guidance: ensure compliance with government regulations, adopt flexible pricing for scaling, and integrate security-driven solutions across platforms.
1. AI‑assisted pipelines lift artist throughput ~2.5× while lowering unit cost.
2. Porting shrinks to ~8 weeks via containerized farms and API abstraction.
3. Auto‑shader/material translation accelerates multi‑renderer delivery.
4. Generative audio/VO speeds localization for global SKUs.
5. Test generation + coverage analytics halve bug escape rates.
6. CI improvements cut time per build ~45% with caching/incremental compiles.
7. Live‑ops personalization monetizes content faster with A/B frameworks.
8. C‑suite dashboard: throughput, $/min content, port weeks, bug %, CI minutes, IRR.

US spend on cloud‑based game development platforms is modeled to grow from ~US$3.8B in 2025 to ~US$13.6B by 2030 as AI content generation and cross‑platform tooling consolidate into studio standard stacks. The dual‑axis figure shows spend rising while average port/build cycle time falls from ~18 to ~8 weeks. Share accrues to vendors offering integrated asset pipelines, procedural generation, and compatibility layers spanning consoles, PC, and mobile. Risks: platform policy changes, store compliance shifts, and engine fragmentation; mitigations: abstraction layers, contract tests, and proactive compliance packs. Share tracking should weigh throughput, $/min content, port weeks, bug %, CI minutes, and IRR—not license counts alone.

Our model shows 3D asset throughput rising ~150% as procedural tools and diffusion models scale; content cost per minute declines ~42%; porting time compresses from ~18 to ~8 weeks with containerized farms and API abstraction; bug escape rate halves; and CI minutes per build drop ~45%. Program IRR grows from ~9% to ~21%. Enablers: ML‑ready asset graphs, feature stores for style/rig parameters, and auto‑shader translation. Barriers: artistic consistency, IP provenance risk, and SKU complexity. Financial lens: value is created through faster content cycles, wider platform reach, and reduced rework. The bar figure summarizes KPI shifts under disciplined deployments.
\

1) Asset provenance graphs track licenses, creators, and dataset lineage. 2) Procedural and diffusion models co‑pilot artists with style locks to maintain IP. 3) Auto‑shader/material translation bridges renderers (DX12, Vulkan, Metal) and solves PBR edge cases. 4) Programmatic porting templates codify input, UI, and store compliance. 5) LLM‑generated test scripts cover flows and edge cases. 6) Synthetic telemetry enables safe A/B for monetization and difficulty. 7) Speech/music generation accelerates localization while preserving tone. 8) Hybrid cloud render farms burst for peak sprints. 9) Plugin marketplaces shift tooling to usage‑based pricing. 10) Explainable AI assists creative direction and compliance reviews.
AAA/AA: cinematic assets, complex physics, multi‑SKU launches; biggest gains from auto‑shader translation and test generation. Mobile F2P: live‑ops cadence, personalization, and UA creatives; focus on rapid content iteration. Indie: cost‑efficient pipelines and creator tools. Live‑Ops: event generation, A/B frameworks, and dynamic difficulty. Middleware/Tools: portability layers, asset validators, and compliance packs. Across segments, track throughput, $/min content, port weeks, bug %, CI minutes, and IRR; tune targets per SKU complexity and team size.
By 2030, we model US use‑case spend mix as AI Content (~30%), Porting/Tooling (~24%), Testing & CI (~16%), Live‑Ops Personalization (~14%), Multiplayer/Netcode (~10%), and Marketplaces (~6%). The pie figure reflects this allocation. Adoption clusters around West Coast/Seattle (engine/tooling), Austin/LA (AAA/AA) and Montreal/Austin satellite for North America collaboration. Execution: standardize porting templates, invest in asset provenance, and enforce SLAs for build queues and regression detection.

Competition spans engines, cloud providers, asset platforms, and test/CI vendors. Differentiation vectors: (1) integrated asset + porting pipelines, (2) shader/material translation quality, (3) provenance and compliance controls, (4) CI scale and queuing latency, and (5) pricing tied to content/porting outcomes. Procurement guidance: require open APIs, license provenance proofs, build/QA SLAs, and usage‑based cost models with caps. Competitive KPIs: throughput, $/min content, port weeks, bug %, CI minutes, and IRR uplift.
1. 5G with QoS/slicing reduces tail latency for safe BVLOS tele‑operations.
2. Cloud control towers centralize fleet telemetry, handoff, and fail‑safes.
3. Automated UTM compresses authorization cycles and cuts violations.
4. Healthcare and retail corridors anchor utilization and unit economics.
5. Route density and autonomy halve cost per delivery by 2030 (modeled).
6. Redundancy: dual C2 links + local autonomy protect against outages.
7. Compliance posture: remote ID, auditable logs, SBOMs, and incident KPIs.
8. CFO dashboard: latency, success %, cost/delivery, violations/10k, auth time, IRR.

US–Canada spend on drone cloud control and UTM is modeled to rise from ~US$1.2B in 2025 to ~US$5.6B by 2030 as BVLOS operations scale across retail, healthcare, and industrial corridors. The line figure charts the investment ramp. Share accrues to platforms that combine reliable C2 over 5G, automated authorization, and auditable safety tooling. Execution risks: capex phasing, regulatory variance by state/province, and weather volatility. Mitigations: corridor‑first deployments, redundancy and DAA coverage maps, and standardized evidence logs.

Economics improve with lower latency, higher mission success, and faster authorizations. We model 95p E2E command latency improving from ~180ms to ~70ms through prioritized 5G lanes; mission success rising from ~88% to ~97% via autonomy and DAA; cost per delivery halving from ~US$7.8 to ~US$3.9 with route density and automated dispatch; violations dropping from ~3.4 to ~0.9 per 10k flights; and authorization time compressing from ~4.5 to ~1.2 minutes with UTM automation. Enablers: cloud control towers, QoS/slices, integrated UTM/LAANC, and weather intelligence. Barriers: RF interference, community noise, and ice/heat extremes in specific geographies.
Financial lens: attribute savings vs ground couriers and avoided failed deliveries; add revenue from premium SLAs for healthcare and rural coverage; net against connectivity, software, and CapEx/OpEx for fleets. The bar chart summarizes directional KPI movement under disciplined execution.

1) Corridor‑first BVLOS unlocks utilization and predictable SLAs. 2) Priority 5G slices emerge for C2 and telemetry with failover paths. 3) Cloud control centers standardize remote pilot handoff and incident response. 4) UTM/LAANC automation reduces manual airspace coordination. 5) Weather intelligence and micro‑forecasts guide dispatch windows. 6) Quiet prop designs and community engagement manage noise acceptance. 7) Healthcare corridors set higher safety and audit bars. 8) Insurers price risk on incident‑per‑10k and compliance logs. 9) Integration with retail OMS/WMS automates pick‑to‑flight. 10) Digital twins simulate routes, density, and risk for planning and regulators.
Retail Last‑Mile: demand‑dense metro routes; monetize speed premiums; manage noise and landing permissions. Healthcare & Critical: cold chain, specimen runs, and hospital corridors; highest safety and audit demands. B2B Intracampus/Industrial: predictable routes; strong ROI via automation and access control. Rural Logistics & Postal: sparse density but high social value; subsidies and shared corridors improve economics. Infrastructure Inspection: recurring flights; strong UTM value for deconfliction near critical assets. Across segments, define SLAs, safety thresholds, and dispatch logic; track latency, success %, cost/delivery, violations/10k, authorization time, and IRR by segment.
By 2030, we model North American drone‑delivery revenue/workload mix as Retail Last‑Mile (~30%), Healthcare & Critical (~18%), B2B Intracampus/Industrial (~16%), Rural Logistics & Postal (~14%), Infrastructure Inspection (~12%), and Other (~10%). US metros lead early through retail density and pilot programs; Canadian corridors scale with healthcare and rural coverage. The pie figure reflects the modeled mix.
Execution: align with federal and local regulators; sequence corridors by density and weather windows; and publish transparent safety logs. Measure region‑specific success %, cost/delivery, violations/10k, authorization time, and IRR; reallocate capex and fleet types (multirotor vs fixed‑wing) quarterly.

Connectivity providers, UTM vendors, cloud platforms, and drone operators compete to define the North American stack. Differentiation vectors: (1) latency control and coverage with redundancy, (2) UTM automation depth and LAANC integration, (3) cloud control maturity (handoff, fail‑safe, audit), (4) OMS/WMS and healthcare integrations, and (5) community acceptance programs. Procurement guidance: require SLA‑backed latency, incident‑per‑10k, authorization time, and audit immutability; demand open APIs and device attestation; and pilot corridors with clear utilization targets. Competitive KPIs: latency, mission success %, cost/delivery, violations/10k, authorization time, corridor utilization, and IRR.
1. Arabic/English ASR+NLU accuracy is the gating factor for containment & CSAT.
2. Agent assist and next‑best‑action compress AHT and raise FCR.
3. RAG knowledge + CRM context personalizes resolution and upsell offers.
4. Quality automation reduces handle variance and improves compliance.
5. Omnichannel orchestration enables journey continuity across chat/voice/social.
6. Real‑time sentiment guides tone and escalations, lifting CSAT and retention.
7. Data residency, redaction, and consent logs underpin privacy assurance.
8. CFO dashboard: AHT, FCR %, containment %, CSAT, $/contact, attrition %, IRR.

MENA/Egypt CCaaS+AI spend is modeled to grow from ~US$0.9B in 2025 to ~US$3.6B by 2030 as brands standardize cloud contact operations and deploy real‑time analytics for sentiment, intent, and guidance. The line figure shows the trajectory. Share accrues to providers with dialect‑tuned ASR/NLU, channel breadth (voice/WhatsApp/web/social), and deep CRM/CDP integrations. Execution risks include legacy telephony cutover and skills gaps; mitigations are phased migrations, partner training, and robust monitoring. Share should be tracked via AHT, FCR %, containment %, CSAT, $/contact, attrition %, and IRR.

AI unlocks measurable improvements: in our model AHT improves ~26%, FCR rises ~13 points, containment more than doubles to ~42%, CSAT lifts by ~0.5, cost per contact falls ~28%, and attrition drops ~12 points—driving IRR from ~8% to ~18%. Enablers: accurate ASR/NLU in Egyptian Arabic and English, RAG knowledge bases kept current, and agent assist woven into workflows. Barriers: model accuracy for dialectal speech, data governance for recordings, and legacy CRM customizations.
Financial lens: value arises from lower handle time and higher containment (fewer agent minutes), increased conversion from personalized offers, and reduced attrition hiring costs. The bar chart summarizes KPI movement under disciplined programs.

1) Dual‑language (Arabic/English) models become table‑stakes for Egypt. 2) Real‑time guidance fuses sentiment, policy, and next‑best‑action. 3) Omnichannel journeys rely on intent‑based routing and unified histories. 4) Quality automation (auto‑scorecards, redaction) scales compliance. 5) Personalization shifts from static scripts to dynamic offers informed by CDP segments. 6) CX agents become ‘knowledge strategists’ with coaching insights. 7) Trust centers expose consent, data lineage, and retention. 8) Carbon‑aware cloud routing and right‑sizing optimize spend and ESG footprints. 9) Agent‑assist copilots require guardrails to prevent hallucinated guidance. 10) Measurement standardizes on AHT, FCR, containment, CSAT, $/contact, and churn/retention.
Banking/Financial Services: high compliance; focus on authentication, dispute resolution, and personalized offers. Telecom: large inbound volumes; priority on outage, billing, and upsell journeys. Travel & Hospitality: multilingual support; disruption handling and proactive outreach. Retail/E‑commerce: order status, returns, and live promotions; WhatsApp and social channels dominate. Public Services: accessibility and cost‑to‑serve; knowledge‑led deflection. Across segments, define SLAs, redaction policies, and coaching regimes; track AHT, FCR, containment, CSAT, $/contact, attrition, and IRR per queue.
By 2030, we model MENA/Egypt CCaaS+AI spend/use‑case mix as Sentiment & Intent (~22%), Agent Assist & NBA (~20%), Omnichannel Orchestration (~18%), Personalization & Offers (~16%), Voicebots/Chatbots (~14%), Quality Automation & Compliance (~10%). Cairo leads early with enterprise deployments; secondary cities adopt WhatsApp‑centric journeys via cloud‑first rollouts. The pie figure reflects the modeled mix.
Execution: prioritize dialect‑tuned ASR/NLU, data residency, and CRM/CDP integrations; publish KPI dashboards and iterate quarterly with A/B tests.

Competition spans global CCaaS suites, regional integrators, and niche AI vendors. Differentiation vectors: (1) Arabic/English ASR/NLU accuracy and latency, (2) deep CRM/CDP connectors and real‑time APIs, (3) guidance quality and controllability, (4) compliance tooling (redaction, consent, audit), and (5) time‑to‑value via templates and playbooks. Procurement guidance: require open APIs, evidence of dialect tuning, redaction/PII tooling, and KPI‑linked case studies. Competitive KPIs: AHT, FCR %, containment %, CSAT, $/contact, attrition %, and IRR uplift.
1. Smart contracts reduce payout latency from ~45 to ~14 days by 2030.
2. Identifier coverage (ISRC/ISWC/ISBN/ISNI) is the #1 driver of dispute reduction.
3. Hybrid ledgers: permissioned settlements with public proofs for auditability.
4. Serverless event processing lowers $/royalty while scaling to burst traffic.
5. Creator portals + APIs increase transparency and trust in split accounting.
6. AML/KYC and eIDAS signatures standardize compliant payouts across the EU/UK.
7. Behavioral scoring and anomaly detection reduce fraud and gaming of streams.
8. C‑suite dashboard: latency days, dispute %, transparency %, audit %, $/royalty, fraud %, IRR.

EU/UK royalty technology spend is modeled to grow from ~US$1.1B in 2025 to ~US$4.6B by 2030 as platforms converge on cloud‑based ledgers and standardized telemetry. The dual‑axis figure shows spend growth alongside payout latency falling from ~45 to ~14 days. Share accrues to vendors with (1) strong identifier coverage and repertoire graphs, (2) scalable event pipelines and matching, and (3) hybrid ledger designs with exportable proofs. Execution risks: metadata gaps and complex cross‑border rights; mitigations: catalog remediation, pre‑cleared contract templates, and integration with societies and DSPs. Share should be tracked via latency days, dispute %, transparency %, audit %, $ per royalty, fraud %, and IRR—not revenue alone.

Our model shows disputes falling from ~7.5% to ~2.8% with better ID coverage and matching; transparency expanding to ~88% of catalog; auditability to ~94% with public proofs; processing cost per royalty improving from ~$0.041 to ~$0.022 via serverless and batch optimization; and fraud rate declining to ~0.8% as behavioral scoring matures. IRR grows ~8→~18% with cash‑flow acceleration and fewer write‑backs. Enablers: event streaming, contract engines, and AML/KYC automation. Barriers: heterogeneous rights data and inconsistent reporting formats across DSPs and territories.
Financial lens: value creation comes from faster payouts (lower working capital), dispute avoidance, and reduced back‑office effort. The bar figure summarizes KPI shifts for disciplined programs.

1) Hybrid ledger architectures balance privacy with public verifiability. 2) Repertoire graphs fuse IDs (ISRC/ISWC/ISNI/ISBN) and contributor roles for conflict resolution. 3) Streaming event analytics detect anomalies (looping, bots) and adjust settlements. 4) Dynamic smart contracts support variable splits and rev‑share floors. 5) Creator portals expose near‑real‑time accruals and statements. 6) Privacy‑preserving proofs enable audits without exposing PII. 7) Cross‑border licensing simplifies via templates and oracles for FX and tax. 8) ESG reporting adds creator payment equity and speed metrics. 9) Open APIs and exportable proofs reduce lock‑in. 10) Outcome‑based pricing aligns vendor comp with latency and dispute reduction targets.
Music/PROs: high event volume; focus on repertoire coverage, cue sheet resolution, and micro‑payout economics. Video/OTT/FAST: multi‑territory rights and ad‑supported splits; need per‑impression matching. Publishing: complex contributor hierarchies; ISBN/ISNI normalization. Gaming & In‑Game Assets: item licensing and UGC revenue sharing. UGC/Creator Platforms: frequent micro‑payouts with bot/fraud controls. Across segments, track latency days, dispute %, transparency %, audit %, $/royalty, fraud %, and IRR; define SLAs for matching and settlement runs by segment.
By 2030, we model EU/UK spend/use‑case mix as Music & PROs (~30%), Video/OTT & FAST (~22%), Publishing (~16%), Gaming & In‑Game (~14%), UGC/Creator (~12%), and Licensing/NFT‑adjacent (~6%). The pie figure reflects the mix. UK hubs (London/Manchester) lead adoption for music and creator platforms; major EU territories expand with cross‑border licensing templates. Execution: invest in identifier remediation, integrate with societies/DSPs, and publish audit proofs and latency dashboards.

Competition spans cloud providers, royalty platforms, rights societies, and blockchain middleware. Differentiation vectors: (1) identifier coverage and matching precision, (2) smart‑contract flexibility and governance, (3) audit proof exports and regulator‑readiness, (4) AML/KYC payouts and tax handling, and (5) time‑to‑value via templates. Procurement guidance: require open APIs, exportable proofs, latency and dispute SLAs, and cross‑border licensing support. Competitive KPIs: payout latency (days), dispute %, transparency %, audit %, $/royalty, fraud %, and IRR uplift.
1. Forecast error (MAPE) drops to ~5–6% with driver-based feature stores.
2. Context-aware anomalies (precision ~90%, recall ~88%) cut waste quickly.
3. Autonomous rightsizing & scheduling reduce idle capacity to ~6%.
4. Commitment management lifts coverage and lowers unit compute cost.
5. Chargeback & unit economics align engineering with P&L outcomes.
6. Policy-as-code enforces budgets/SLOs with automated guardrails.
7. FinOps data lakes unify CURs, telemetry, and tags for explainable savings.
8. CFO dashboard: MAPE %, precision/recall %, TTR hrs, idle %, unit cost, IRR %.

US spend on AI FinOps and cost governance platforms is modeled to rise from ~US$2.0B (2025) to ~US$8.2B (2030) as enterprises adopt anomaly detection, driver-based forecasting, and automated rightsizing at scale. The line figure shows the investment trajectory. Share accrues to vendors that deliver multi-cloud coverage, explainable savings, and closed-loop remediation. Execution risks include tag hygiene, shadow IT, and SKU complexity; mitigations are hierarchical tagging standards, CSP-native ingestion, and commitment simulators that span clouds and terms.

Quantitative improvements drive the business case: forecast MAPE falls from ~14.0% to ~5.5%; anomaly precision/recall improves to ~90/88%; TTR for cost spikes drops from ~36 to ~6 hours; idle resource rate falls from ~18% to ~6%; and unit compute cost declines from ~US$0.072 to ~US$0.048 by 2030. Enablers: driver-based feature stores, graph/context models, policy-as-code guardrails, and automation hooks into orchestrators. Barriers: noisy data, complex pricing catalogs, and organizational friction between platform and product teams.
Financial lens: attribute savings to rightsizing, commitment coverage, and anomaly prevention; add acceleration value from fewer budget freezes; net against tool/license costs and platform work. The bar chart summarizes KPI movement under disciplined programs.

1) Driver-based forecasting overtakes time-series only models as teams feed real business signals. 2) Context graphs fuse tags, service maps, and metrics to reduce false positives. 3) Automation playbooks remediate safely with rollbacks and guardrails. 4) Unit economics and chargeback become standard; consumption limits are codified. 5) FinOps data lakes unify CURs, telemetry, and purchase commitments with lineage. 6) Cloud vendors expose richer pricing APIs; marketplaces add commitment arbitrage. 7) GPU/AI workloads get specialized rightsizing and queue scheduling. 8) Sustainability joins cost in dashboards (kWh/CO₂ per unit). 9) Synthetic tests validate savings attribution. 10) Procurement buys outcomes (savings SLAs), not just tools.
Digital-Native SaaS: fastest to adopt autonomous rightsizing; focus on margin expansion. Financial Services: strict budgets and compliance; priority on explainability and rollback safety. Retail/CPG: strong seasonality; driver-based models and anomaly controls around events. Media/Gaming: bursty workloads; commitment hedging and queue-based GPU scheduling. Healthcare/Life Sciences: cost + compliance reporting; fine-grained unit economics. Public Sector: budget ceilings; conservative automation with detailed audit trails. KPIs per segment: MAPE %, precision/recall %, TTR hrs, idle %, unit cost, savings %.
By 2030, we model the USA spend/use-case mix for AI cost governance as: Anomaly Detection & Root Cause (~24%), Budget Forecasting & Scenario Planning (~22%), Autonomous Rightsizing & Scheduling (~20%), Commitment Management (~16%), Chargeback & Unit Economics (~12%), and FinOps Data Lake & Governance (~6%). US coastal tech hubs drive early adoption; central regions scale in retail/CPG and financial services. The pie figure reflects the mix.
Execution: standardize tagging and allocation, align budgets with engineering SLOs, and run quarterly commitment simulations. Measure region- and industry-specific MAPE, precision/recall, TTR, idle %, and unit cost; reallocate commitments and automation scope accordingly.

Vendors range from cloud-native FinOps platforms to CSP-native tools and observability suites. Differentiation vectors: (1) driver-based forecasting accuracy, (2) anomaly precision/recall with context graphs, (3) automation depth with safe rollbacks, (4) commitment simulators across multi-cloud, and (5) attribution transparency. Procurement guidance: require open billing/pricing APIs, evidence of KPI lift (MAPE, TTR, idle %, unit cost), and controls for approvals/audit. Competitive KPIs: forecast error, precision/recall, remediation time, idle %, unit cost, and realized savings ROI.