Get in touch with us to learn more about our services, ask for assistance with a technical difficulty, or if you would like a product demo.
info@nextyn.com
Singapore
68 Circular Road, #02-01
049422, Singapore
Jakarta

Revenue Tower, Scbd, Jakarta 12190, Indonesia
Mumbai
4th Floor, Pinnacle Business Park, Andheri East, Mumbai, 400093
Bangalore

Cinnabar Hills, Embassy Golf Links Business Park, Bengaluru, Karnataka 560071
Twitter IconInstagram FaviconLinkedin Icon

Connect With Us

Thank you for submitting the form
Oops! Something went wrong while submitting the form.
Industry:
Energy, Sustainability & Environment

China’s EV Export Domination vs. Western Trade Barriers: Policy Risks, Competitive Response & Supply Chain Realignment (2025–2030)

China has emerged as the world’s largest EV exporter, shipping over 5 million units annually by 2030, but faces mounting trade barriers in the EU and U.S. Western governments are responding with tariffs, anti-subsidy probes, and local supply chain mandates. This report analyzes the policy risks, competitive responses by Western OEMs, and the resulting supply chain realignments shaping global EV trade flows between 2025–2030.

A graphic showing Transcript IQ topical report
Category: 
Advanced
Insight Code: 
65K1E
Format: 
PDF / PPT / Excel
Deliverables: Primary Research Report + Infographic Pack

What's Covered?

What is the scale of China’s EV export growth through 2030?
How are EU and U.S. trade barriers impacting Chinese OEMs?
Which Chinese OEMs dominate exports, and which markets are they targeting?
How are Western OEMs responding to Chinese competition?
What is the impact of tariffs on EU EV pricing and consumer adoption?
How do battery and component supply chains shift under trade restrictions?
What role do India, Mexico, and Southeast Asia play in realignment?
How sustainable is China’s cost advantage under policy pressure?
What risks exist for global OEM alliances and joint ventures?
What scenarios emerge if trade tensions escalate vs. relax by 2030?

Report Summary

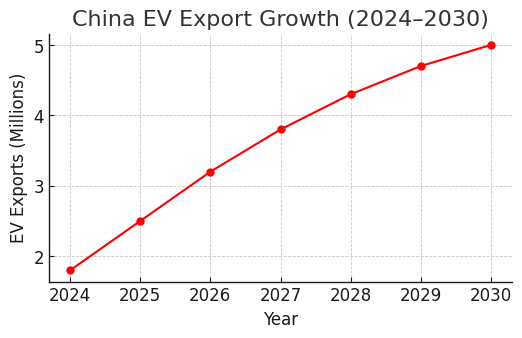
1. China’s EV Export Growth (2024–2030)

China’s EV exports are projected to grow from 1.8M units in 2024 to nearly 5M units annually by 2030. Europe remains the top destination with over 50% share, while Latin America, Africa, and Southeast Asia emerge as secondary growth markets.

2. Tariff Impacts on EV Prices

The EU’s proposed 10–20% anti-subsidy tariffs could raise EV prices in Europe by 8–12% by 2030. In contrast, U.S. IRA rules fully exclude Chinese EVs from subsidies, effectively pricing them out of the U.S. market.

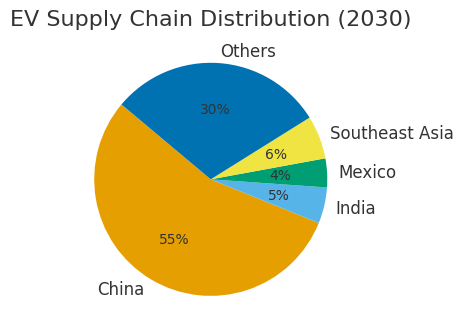
3. Supply Chain Realignment

Trade barriers are forcing diversification of EV supply chains. By 2030, China’s share of global EV supply chains is projected to fall from 70% to ~55%, with India, Mexico, and Southeast Asia gaining a combined 15% share.

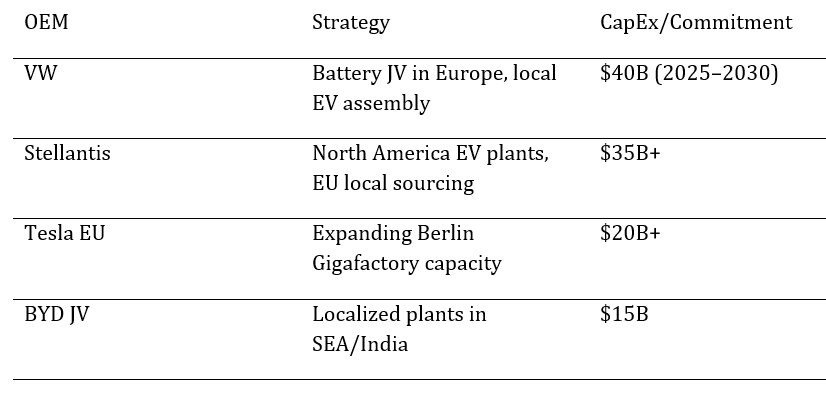
4. Western OEM Strategic Responses

Western OEMs are increasing investments in localized production, joint ventures, and battery partnerships to reduce reliance on Chinese imports and comply with trade rules.

5. Tariffs and EU EV Adoption

The imposition of tariffs raises EV costsfor European consumers. By 2030, EU EV adoption could be 5–7% lower thanbaseline if tariffs remain at 20%. Germany and France are the most affected dueto high reliance on Chinese imports, while Italy and Spain diversify sourcingfaster.

6. Battery & Component Supply Chains

Battery cell and component sourcing remainsChina-dominated, but new plants in Hungary, Poland, and Mexico are capturing~10% share by 2030. Restrictions on Chinese graphite and lithium inputs couldadd $15–20/kWh to EU pack costs.

7. Role of India, Mexico & Southeast Asia

India, Mexico, and Southeast Asia attractsignificant OEM investment to diversify supply chains. By 2030, these regionscould account for ~15% of EV exports to the West, reducing China’s dominance.

8. China’s Cost Advantage

Even under tariffs, Chinese EVs maintain a15–20% cost advantage due to economies of scale, integrated supply chains, andstate subsidies. However, stricter trade rules and logistics costs could erodemargins by 5–7% by 2030.

9. OEM Alliances & JV Risks

Joint ventures between Chinese and Western OEMs face political scrutiny. Examples include potential reviews of BYD–Teslacollaborations in Europe and CATL supply deals. JV risks include blockedapprovals, stranded Capex, and IP exposure.

10. Scenarios for Trade Tensions

Two scenarios dominate outlook: (a)Escalation – tariffs expand to 25–30%, further reducing EU adoption andsparking WTO disputes. (b) Relaxation – post-2030 gradual rollback of tariffsif Chinese OEMs localize production in Europe. Base case assumes moderatedtariffs but permanent partial restrictions.

Key Takeaways

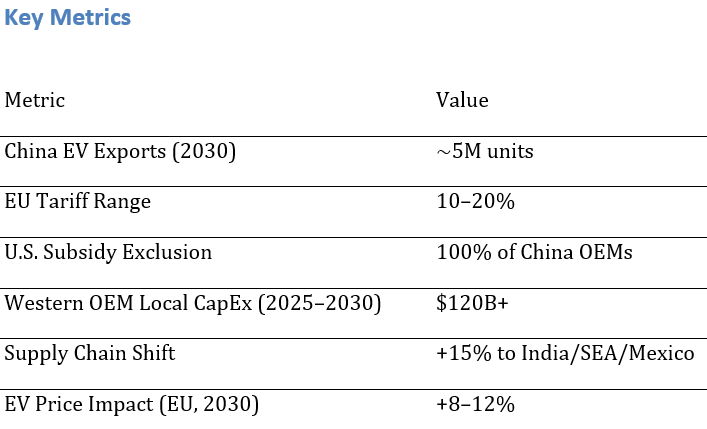
• China’s EV exports projected to hit 5M units annually by 2030.

• EU investigating anti-subsidy tariffs of 10–20% on Chinese EV imports.

• U.S. Inflation Reduction Act (IRA) effectively excludes Chinese OEMs from subsidies.

• Western OEMs (VW, Stellantis, Tesla EU) increasing localization of battery/assembly plants.

• Global battery supply chain diversification: India, Mexico, Southeast Asia gaining share.

• Trade barriers could raise EU EV prices by 8–12% by 2030.

Report Details

Last Updated: September 2025
Base Year: 2024
Estimated Years: 2025 - 2030

Proceed To Buy

Thank you! Your submission has been received!
Oops! Something went wrong while submitting the form.
Download Free PDF

Want a More Customized Experience?

  • Request a Customized Transcript: Submit your own questions or specify changes. We’ll conduct a new call with the industry expert, covering both the original and your additional questions. You’ll receive an updated report for a small fee over the standard price.
  • Request a Direct Call with the Expert: If you prefer a live conversation, we can facilitate a call between you and the expert. After the call, you’ll get the full recording, a verbatim transcript, and continued platform access to query the content and more.

Get in touch with us to learn more about our services, ask for assistance with a technical difficulty, or if you would like a product demo.
info@nextyn.com
Singapore
68 Circular Road, #02-01
049422, Singapore
Jakarta

Revenue Tower, Scbd, Jakarta 12190, Indonesia
Mumbai
4th Floor, Pinnacle Business Park, Andheri East, Mumbai, 400093
Bangalore

Cinnabar Hills, Embassy Golf Links Business Park, Bengaluru, Karnataka 560071
Twitter IconInstagram FaviconLinkedin Icon

Request Custom Transcript

Thank you for submitting the form
Oops! Something went wrong while submitting the form.

Related Transcripts

$ 1350

November 2025

Post-Combustion Carbon Capture, Utilization, and Storage (CCUS) Systems: Solvent-Based Systems & Power Plant Retrofits

Between 2025 and 2030, North American post‑combustion CCUS moves from demonstration to scaled deployment on coal and natural‑gas power plants, cement, and industrial boilers. The economic engine is solvent‑based capture paired with reliable transport and Class VI storage or EOR‑to‑storage transitions. Technology leadership consolidates around advanced amines (e.g., piperazine/AMP blends) and water‑lean/non‑aqueous solvents that cut reboiler duty while sustaining high capture rates and manageable degradation. Retrofit designs standardize: compact absorbers, high‑performance structured packing, lean‑rich heat integration, advanced reclaiming, and corrosion‑resistant metallurgy. Digital twins and plant‑wide optimization reduce parasitic load and ramping penalties. Illustratively, cumulative capture capacity addressed by post‑combustion retrofits in North America could grow from ~13 to ~80 MtCO₂/yr by 2030, with the USA rising from ~10 to ~60 MtCO₂/yr. Energy penalty trends decline from ~3.6 GJ/t (MEA) toward ~2.2–2.5 GJ/t for advanced systems by 2030, with capture efficiencies of ~94–97% at design. Bankability rests on stacked incentives (e.g., tax credits), robust storage permitting, and balance‑of‑plant integration that preserves net output and water management. Risk shifts from core capture performance to integration: steam extraction, ductwork tie‑ins, grid services under capture operation, and solvent management/MRV.

Carbon Capture
USA
North America

$ 1395

November 2025

LNG Storage Storage Infrastructure and Terminal Engineering: 9% Nickel Steel Adoption & Floating Regasification Units

From 2025 to 2030, North American LNG infrastructure pivots on two engineering vectors: the continued dominance of 9% nickel steel in onshore full‑containment tanks and the strategic use of floating storage and regasification units (FSRUs) to add rapid, modular capacity. 9% Ni steel remains the reference material for cryogenic service due to toughness at −196 °C, weldability, and long service life; learning curves, shop prefabrication, and automated welding drive incremental cost and schedule gains through 2030. In parallel, FSRUs compress time‑to‑market by leveraging converted LNG carriers or newbuilds, shifting capex to opex via charter models and enabling seasonal or transitional capacity. Illustratively, cumulative onshore storage additions rise from ~0.6 to ~2.9 million m³ between 2025 and 2030, while FSRU regas capacity scales from ~0.6 to ~4.0 bcf/d. Material selection remains a cost‑and‑schedule decision: 9% Ni steel benchmarks at an index of 100 in 2025 for both cost and lead time; alternatives such as 304L stainless and aluminum alloys carry higher indices today, with moderate convergence by 2030 as supply chains deepen. Risk management focuses on cold box metallurgy, weld QA/QC, and foundation/settlement control for full‑containment tanks; for FSRUs, interface risks dominate (mooring, cryogenic transfer arms, send‑out pressure control) along with marine permitting and hurricane resilience.

Oil & Gas Storage & Transportation
USA
North America

$ 1395

November 2025

Environmental Consulting and Sustainability Management Frameworks: ESG Compliance & Supply Chain Decarbonization Strategies

From 2025 to 2030, North American organizations will navigate a step-change in sustainability management as disclosure requirements expand, supplier expectations tighten, and capital markets reward credible transition plans. The consulting and services market unites three engines of demand: (1) ESG compliance and disclosure across multiple frameworks; (2) supply‑chain decarbonization with granular product and site‑level data; and (3) data platforms and MRV automation that convert sustainability workflows into auditable, repeatable processes. Enterprises are moving beyond one‑off reports toward integrated operating systems that connect finance, procurement, operations, and IT. The winners will operationalize governance, embed decarbonization into sourcing and capex, and instrument supply chains with verifiable data flows. Compliance sets the floor. Public companies confront rising expectations for greenhouse‑gas accounting, climate risk, and sustainability governance; private firms feel pull-through from customers, lenders, and insurers. Meanwhile, supply‑chain decarbonization becomes the cost‑effective frontier: category‑level roadmaps, supplier segmentation, and performance‑based contracts reduce emissions per unit cost. Service providers that pair strategy with execution target setting, data architecture, vendor enablement, and financing unlock durable value.

Environmental Consulting
USA
North America

$ 1450

November 2025
Get in touch with us to learn more about our services, ask for assistance with a technical difficulty, or if you would like a product demo.
info@nextyn.com
Singapore
68 Circular Road, #02-01
049422, Singapore
Jakarta

Revenue Tower, Scbd, Jakarta 12190, Indonesia
Mumbai
4th Floor, Pinnacle Business Park, Andheri East, Mumbai, 400093
Bangalore

Cinnabar Hills, Embassy Golf Links Business Park, Bengaluru, Karnataka 560071
Twitter IconInstagram FaviconLinkedin Icon

Buy Now

Thank you for submitting the form
Oops! Something went wrong while submitting the form.