

68 Circular Road, #02-01 049422, Singapore
Revenue Tower, Scbd, Jakarta 12190, Indonesia
4th Floor, Pinnacle Business Park, Andheri East, Mumbai, 400093
Cinnabar Hills, Embassy Golf Links Business Park, Bengaluru, Karnataka 560071


Connect With Us


68 Circular Road, #02-01 049422, Singapore
Revenue Tower, Scbd, Jakarta 12190, Indonesia
4th Floor, Pinnacle Business Park, Andheri East, Mumbai, 400093
Cinnabar Hills, Embassy Golf Links Business Park, Bengaluru, Karnataka 560071
Connect With Us
68 Circular Road, #02-01 049422, Singapore
Revenue Tower, Scbd, Jakarta 12190, Indonesia
4th Floor, Pinnacle Business Park, Andheri East, Mumbai, 400093
Cinnabar Hills, Embassy Golf Links Business Park, Bengaluru, Karnataka 560071
Request Custom Transcript
Central Bank Digital Currency (CBDC) Pilots and Policy: US Digital Dollar & Digital Euro Impact Analysis (2025–2030)
The CBDC ecosystem is entering a decisive stage, with the U.S. Digital Dollar pilot and Digital Euro program projected to collectively influence over $5.4T in annual payment flows by 2030. The U.S. is currently testing interoperable retail and wholesale CBDC frameworks, focusing on transaction traceability, financial inclusion, and cross-border efficiency. Market projections estimate the U.S. CBDC infrastructure market to reach $3.8B by 2030 (CAGR 18.4%). As policy momentum builds, the Federal Reserve’s Project Hamilton and Digital Dollar Project will determine the scalability of a tokenized, programmable payment infrastructure designed to modernize monetary policy execution and financial stability.
What's Covered?
Report Summary
Key Takeaways
- CBDC infrastructure market in the U.S. to reach $3.8B by 2030 (CAGR 18.4%).
- $5.4T annual payment flow expected through CBDC-linked systems by 2030.
- Pilot transaction speeds exceed 1.7M TPS in distributed test environments.
- CBDC interoperability pilots with the EU and Singapore to expand by 2027.
- 68% of U.S. financial institutions preparing CBDC readiness frameworks.
- Digital Dollar Project testing programmable payments for fiscal transfers.
- Cross-border remittance costs projected to decline by 42%.
- Cash circulation share to drop from 18% to 9% by 2030.
- Data privacy frameworks mandated under U.S. Digital Currency Act (pending).
- 82% of consumers express conditional trust in CBDC systems under transparent governance.
Key Metrics
Market Size & Share
The U.S. CBDC infrastructure market is estimated to grow from $1.6B in 2025 to $3.8B by 2030, with pilot programs expected to process $5.4T in cumulative transactions annually by the end of the decade. The Federal Reserve’s Project Hamilton is testing retail and wholesale prototypes achieving 1.7 million transactions per second, outperforming private blockchain systems. By 2030, over 68% of U.S. financial institutions are projected to have integrated CBDC-compatible payment rails. The Digital Dollar Project, launched with private-sector partners, will establish foundational interoperability between U.S., EU, and Asia-Pacific jurisdictions. The U.S. Treasury and Federal Reserve aim to standardize programmable payment channels for fiscal use cases, including benefit disbursements and stimulus payments.
Market Analysis
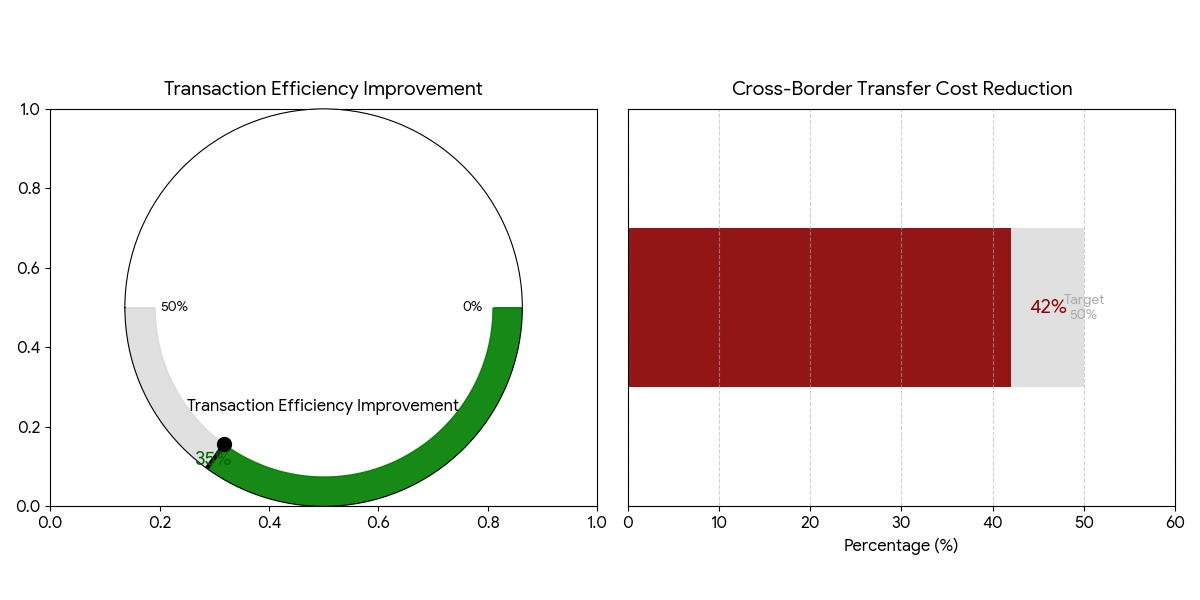
The adoption of CBDC technology in the U.S. reflects an institutional response to both private stablecoins and foreign CBDC advancements. The Digital Dollar framework emphasizes hybrid architecture, combining centralized oversight with decentralized ledger components for transparency. Key pilot results suggest 42% cost reduction in cross-border transfers and 35% improvement in transaction efficiency. The market’s transition phase (2025–2027) will center on interoperability pilots between the U.S. and global central banks. By 2030, real-time programmable settlement systems will underpin treasury operations and central bank liquidity management. The policy dimension remains critical—balancing data privacy, financial inclusion, and AML compliance under emerging legislation such as the Digital Currency Accountability Act.
Trends & Insights
- Programmable Payments: Driving automation in tax refunds, welfare, and payrolls.
- Hybrid CBDC Models: Combining centralized control with distributed validation.
- Privacy-Enhancing Technologies: Federated identity reducing data traceability risks.
- Cross-Border Interoperability: Pilots linking Digital Dollar and Digital Euro networks.
- Financial Inclusion Focus: CBDCs projected to onboard 15M unbanked U.S. citizens.
- Smart Contract Integration: Enabling programmable compliance for retail use cases.
- Commercial Bank Partnerships: New models for retail wallet custody.
- AI Monitoring Tools: Detecting anomalies in CBDC transaction flows.
- Cybersecurity Prioritization: 32% of pilot budgets allocated to quantum-safe encryption.
- Public-Private Collaborations: Defining operating standards through FinCEN-led frameworks.
These insights reveal the U.S. CBDC journey as a balancing act between technological innovation, policy prudence, and public trust building.
Segment Analysis
The U.S. CBDC market segments into retail pilots (45%), wholesale infrastructure (30%), cross-border settlement systems (15%), and regulatory sandboxes (10%). Retail CBDC pilots lead with 45% share, emphasizing digital inclusion and real-time consumer payments. Wholesale infrastructure, at 30%, focuses on interbank settlement systems and liquidity optimization. Cross-border initiatives, representing 15%, explore interoperability with the EU’s Digital Euro and Asia-Pacific corridors. Meanwhile, regulatory sandboxes (10%) facilitate private-public testing of programmable money applications, supporting innovations like tokenized bonds and micro-loan disbursements. This segmentation reflects how the Digital Dollar is shaping a multi-layered financial infrastructure ready for policy-backed scale.
Geography Analysis
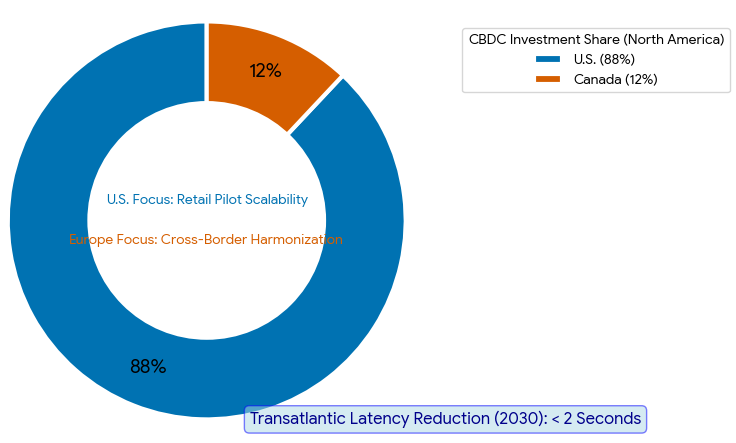
Within North America, the U.S. leads CBDC innovation, accounting for 88% of total regional investments, while Canada contributes 12% through collaborative research with the Bank of England and European Central Bank. The U.S. focus remains on retail pilot scalability, while Europe emphasizes cross-border payment harmonization. By 2030, the Digital Dollar will coexist with private stablecoin ecosystems, enabling multi-rail transaction processing that supports both domestic payments and international settlements. The Digital Euro, progressing in parallel, will enhance U.S.-EU interoperability, reducing transaction latency to under 2 seconds. Together, these initiatives will redefine transatlantic monetary policy coordination and digital financial sovereignty.
Competitive Landscape
Key participants include the Federal Reserve, Digital Dollar Project, MIT’s DCI, Accenture, IBM, and Ripple Labs, alongside Visa, Mastercard, and SWIFT exploring CBDC integration frameworks. Accenture leads pilot design for public-private implementations, while MIT DCI focuses on transaction scalability research. Ripple and IBM are advancing interoperable blockchain layers for cross-border efficiency. Meanwhile, Visa and Mastercard are preparing CBDC-ready payment gateways to enable seamless retail adoption. As regulatory clarity emerges by 2027, these partnerships will accelerate the institutionalization of programmable money, positioning the U.S. Digital Dollar as a cornerstone of the global financial infrastructure of the future.
Report Details
Proceed To Buy
Want a More Customized Experience?
- Request a Customized Transcript: Submit your own questions or specify changes. We’ll conduct a new call with the industry expert, covering both the original and your additional questions. You’ll receive an updated report for a small fee over the standard price.
- Request a Direct Call with the Expert: If you prefer a live conversation, we can facilitate a call between you and the expert. After the call, you’ll get the full recording, a verbatim transcript, and continued platform access to query the content and more.
68 Circular Road, #02-01 049422, Singapore
Revenue Tower, Scbd, Jakarta 12190, Indonesia
4th Floor, Pinnacle Business Park, Andheri East, Mumbai, 400093
Cinnabar Hills, Embassy Golf Links Business Park, Bengaluru, Karnataka 560071
Request Custom Transcript
Related Transcripts
$ 1450


68 Circular Road, #02-01 049422, Singapore
Revenue Tower, Scbd, No.52-53, Jakarta 12190, Indonesia
Cinnabar Hills, Embassy Golf Links Business Park, Bengaluru, Karnataka 560071
4th Floor, Pinnacle Business Park, Andheri East, Mumbai, 400093


68 Circular Road, #02-01 049422, Singapore
Revenue Tower, Scbd, Jakarta 12190, Indonesia
4th Floor, Pinnacle Business Park, Andheri East, Mumbai, 400093
Cinnabar Hills, Embassy Golf Links Business Park, Bengaluru, Karnataka 560071