

68 Circular Road, #02-01 049422, Singapore
Revenue Tower, Scbd, Jakarta 12190, Indonesia
4th Floor, Pinnacle Business Park, Andheri East, Mumbai, 400093
Cinnabar Hills, Embassy Golf Links Business Park, Bengaluru, Karnataka 560071


Connect With Us


68 Circular Road, #02-01 049422, Singapore
Revenue Tower, Scbd, Jakarta 12190, Indonesia
4th Floor, Pinnacle Business Park, Andheri East, Mumbai, 400093
Cinnabar Hills, Embassy Golf Links Business Park, Bengaluru, Karnataka 560071
Connect With Us
68 Circular Road, #02-01 049422, Singapore
Revenue Tower, Scbd, Jakarta 12190, Indonesia
4th Floor, Pinnacle Business Park, Andheri East, Mumbai, 400093
Cinnabar Hills, Embassy Golf Links Business Park, Bengaluru, Karnataka 560071
Request Custom Transcript
Carbon Markets Post-2025: Credit Pricing Volatility, MRV Tech & Corporate Offset Demand
From 2025 to 2030, carbon markets in the USA and Europe are defined by three interacting dynamics: (1) pricing volatility across compliance and voluntary channels; (2) rapid digitization of monitoring, reporting and verification (MRV) via sensors, satellites, and AI; and (3) evolving corporate offset demand as claims standards mature. Compliance systems (EU ETS, UK ETS, California cap-and-trade, and RGGI-type programs) set the investment-grade baseline for carbon costs, influencing internal shadow prices and capital budgeting. Voluntary carbon markets (VCM) continue to play a complementary role particularly for beyond-value-chain contributions but are undergoing quality stratification and methodology consolidation that directly affects price dispersion and hedging strategies. Volatility stems from policy reforms, methodology updates, integrity ratings, and liquidity conditions. For corporates, this means shifting from spot purchases to structured procurement: multi-year offtake, price collars, replacement rights, and index-linking against recognized benchmarks.
What's Covered?
Report Summary
Key Takeaways
1) Treat compliance prices as the baseline carbon cost; set internal shadow prices accordingly.
2) Expect persistent price dispersion in the VCM driven by integrity tiering and methodology updates.
3) Shift from spot buying to structured multi‑year offtake with collars, replacement rights, and quality ratchets.
4) Embed MRV tech (sensors, satellites, AI) in contracts to reduce measurement uncertainty and audit lag.
5) Anchor claims in CCP/VCMI‑aligned frameworks; build Article 6 awareness to avoid double counting.
6) Segment procurement by business unit: aviation, industrials, consumer brands, finance have distinct playbooks.
7) Adopt portfolio analytics and meta‑registry reconciliation for assurance‑ready records.
8) Plan a migration path toward 20–40% removals share by 2030 while maintaining cost‑effective NBS volume.
Key Metrics

Market Size & Price Outlook (USA & Europe)
Compliance systems (EU ETS, UK ETS, California, RGGI‑type programs) define the baseline cost of carbon; illustrative trajectories suggest firming allowance levels through 2030 as caps tighten and reforms mature. In the voluntary market, a mid‑grade baseline rises modestly, while a separate volatility index declines as MRV technology and integrity screens reduce uncertainty and improve liquidity. Corporates model these curves jointly: compliance prices for budgeting and investment screening; VCM baselines and volatility for procurement strategy. Aviation continues to drive standardized demand via EU ETS for intra‑EU and CORSIA for international flights, while industrials lean on compliance hedging and selective VCM contributions. The practical outcome is a dual‑curve playbook one curve anchoring internal carbon pricing; the other informing tiered willingness‑to‑pay across credit categories and risk bands.

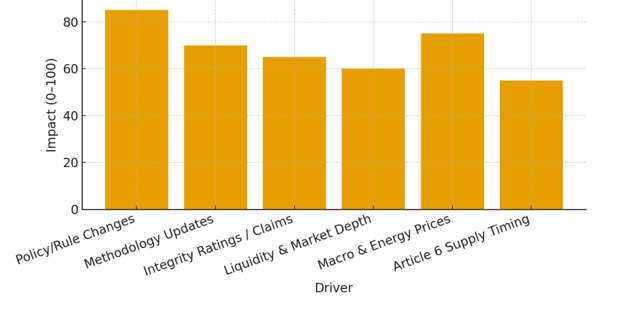
Market Analysis (Volatility Drivers)
Credit pricing volatility originates from six primary drivers. Policy and rule changes shift compliance demand and eligibility rules, especially when free allocation or sector coverage evolves. Methodology updates alter supply eligibility and baselines in the VCM, periodically repricing large project cohorts. Integrity ratings and claims frameworks can move premiums as CCP/VCMI alignment tightens. Liquidity depth affects transaction costs and basis risk; exchange listing and market‑making improve stability. Macro and energy prices filter into compliance markets and developer economics, indirectly shaping VCM supply. Finally, Article 6 supply timing authorizations, corresponding adjustments, registry connectivity affects cross‑border claim confidence.
Mitigation tactics: (1) diversify by category, registry, and geography; (2) use price collars and benchmark‑linked settlements; (3) pre‑define replacement rights for methodology changes; (4) maintain buffers for invalidation and downgrade risk; (5) embed MRV SLAs with data access; and (6) negotiate transparent tariffing for registry, exchange, and verification services. Together, these measures compress variance bands and improve predictability of delivered cost per tone.
Trends & Insights (2025–2030)
MRV digitization: sensor networks, remote sensing, and AI anomaly detection enter mainstream portfolios, cutting verification lag and reducing uncertainty. Integrity consolidation: CCP/VCMI adoption becomes standard; meta‑registries unify data and reduce double‑counting risk. Article 6: bilateral arrangements and registry upgrades scale, enabling more robust cross‑border claims. Structured procurement: multi‑year offtake with collars, indices, and volume‑flex replaces spot buying. Finance integration: insurers and lenders increasingly require MRV‑first documentation for credit facilities; assurance-ready records become a condition for reputational risk management. Premium persistence: high‑integrity credits (especially removals) retain pricing power; mid‑grade reductions remain cost‑effective volume backbone. Overall volatility moderates relative to 2025 levels, but event‑driven spikes remain.
Segment Analysis (Buyer Profiles)
Industrial & Power: Heavy compliance exposure; prioritize ETS hedging and use VCM for contribution claims with clear separation from compliance obligations. Aviation: Dual regimes (EU ETS/CORSIA); standardized pools and index‑linked procurement reduce operational complexity. Consumer & Retail: Emphasize NBS with co‑benefits; gradually add removals as budgets allow. Financial Services: Focus on assurance‑ready records and MRV‑integrated analytics; prefer offtake with high integrity and clear delivery schedules. Technology & Manufacturing: Analytics‑driven rebalancing across categories as ratings and methodologies evolve. Public Sector & Cities: Pilot contribution programs aligned with local goals; require transparent claims and data access.
Geography Analysis (USA & Europe Readiness)
Readiness for MRV‑first procurement and structured contracts is strongest in EU Nordics/Benelux, the UK, and US states covered by California or RGGI‑type programs, where policy alignment, buyer sophistication, and market access are high. DACH and France show solid progress, with growing data infrastructure and assurance ecosystems. Iberia and CEE are improving but still trail on liquidity and integrity infrastructure depth. In the USA beyond California/RGGI, readiness is uneven but rising through corporate programs and exchange penetration. Multi‑region buyers should stagger procurement, align claims governance with local regimes, and maintain enterprise‑wide integrity standards.

Competitive Landscape (Ecosystem & Intermediaries)
Ecosystem participants include compliance registries and exchanges, VCM registries and methodologies, ratings providers, meta‑registries, data platforms, brokers/exchanges, and MRV technology vendors. Competitive edge comes from integrity alignment, transparent data access, delivery reliability, and structured contracting toolkits. MRV vendors differentiate on measurement accuracy, latency, and interoperability (APIs). Exchanges and brokers compete on liquidity, basis risk management, and index products. Developers of engineered removals prioritize offtake bankability, while NBS developers differentiate via jurisdictional programs and co‑benefit measurement. Expect consolidation and platformization, with bundled analytics‑contracting‑assurance SLAs.
Report Details
Proceed To Buy
Want a More Customized Experience?
- Request a Customized Transcript: Submit your own questions or specify changes. We’ll conduct a new call with the industry expert, covering both the original and your additional questions. You’ll receive an updated report for a small fee over the standard price.
- Request a Direct Call with the Expert: If you prefer a live conversation, we can facilitate a call between you and the expert. After the call, you’ll get the full recording, a verbatim transcript, and continued platform access to query the content and more.
68 Circular Road, #02-01 049422, Singapore
Revenue Tower, Scbd, Jakarta 12190, Indonesia
4th Floor, Pinnacle Business Park, Andheri East, Mumbai, 400093
Cinnabar Hills, Embassy Golf Links Business Park, Bengaluru, Karnataka 560071
Request Custom Transcript
Related Transcripts


68 Circular Road, #02-01 049422, Singapore
Revenue Tower, Scbd, No.52-53, Jakarta 12190, Indonesia
Cinnabar Hills, Embassy Golf Links Business Park, Bengaluru, Karnataka 560071
4th Floor, Pinnacle Business Park, Andheri East, Mumbai, 400093


68 Circular Road, #02-01 049422, Singapore
Revenue Tower, Scbd, Jakarta 12190, Indonesia
4th Floor, Pinnacle Business Park, Andheri East, Mumbai, 400093
Cinnabar Hills, Embassy Golf Links Business Park, Bengaluru, Karnataka 560071